
Application Guide


466 Data Collection
To determine the numerical 2nd derivative of List B with respect to List A, enter the
following express:
derivative(B,A,2,0) or derivative (B,A,2,1)
The last parameter is either 0 or 1 depending on the method you are using. When it is
0, a weighted average is used. When it is 1, a time shifted derivative method is used.
Note: The first derivative calculation (weighted average) is what the Tangent tool uses
to display the slope at a data point when examining data. (Analyze > Tangent).
Note: The derivative calculation is completely row based. It is recommended that your
List A data be sorted in ascending order.
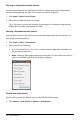
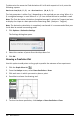
1. Click Options > Derivative Settings.
The Settings dialog box opens.
2. Select the number of points from the drop-down list.
3. Click OK.
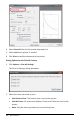
Drawing a Predictive Plot
Use this option to add points to the graph to predict the outcome of an experiment.
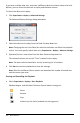
1. Click the Graph View tab .
2. From the Analyze menu, select Draw Prediction > Draw.
3. Click each area in which you want to place a point.
4. Press Esc to release the drawing tool.
5. To clear the drawn prediction, click Analyze > Draw Prediction > Clear.