
Application Guide


Using Motion Match
Use this option to create a randomly generated plot when creating position-versus-time or
velocity-versus-time graphs.
This feature is only available when using a motion detector such as the CBR2™ sensor or
the Go!Motion® sensor.
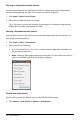
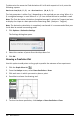
Generating a Motion Match Plot
To generate a plot:
1. Attach the motion detector.
2. Click View > Graph.
3. Click Analyze > Motion Match.
4. Select one of the following options:
• New Position Match. Generates a random position plot.
• New Velocity Match. Generates a random velocity plot.
Note: Continue selecting a new position or a new velocity match to generate a new
random plot without removing the existing plot.
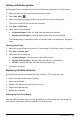
Removing a Motion Match Plot
To remove the generated plot:
▶ Click Analyze > Motion Match > Remove Match.
Printing Collected Data
You can only print from the computer. You can print any single displayed active view, or
with the Print All option:
• One data view.
• All of the data views.
• A combination of the data views.
The Print All option has no effect on applications outside of the Vernier DataQuest™
application.
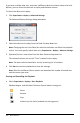
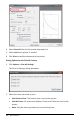
Printing Data Views
To print a data view:
1. On the main menu (top of the window), click File > Print.
The Print dialog box opens.
Data Collection 467