
Application Guide

57 Graphs Application
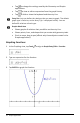
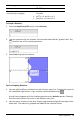
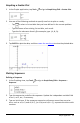
3. Tap the specific template for the equation. For example, tap y=a•x
2
+b•x+c to
define a parabola.
The entry line includes a symbol to indicate the type of equation.
4. Type the coefficients into the equation template.
5. Tap ENTER.
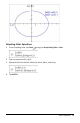
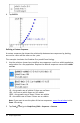
Graphing Relations
Relation graphing is available on Graphs pages and in the Analytic Window of
Geometry pages.
You can define relations using ≤, <, =, >, or ≥. The inequality operator (≠) is not
supported in relation graphing.
Relation type Examples
Equations and inequalities
equivalent to
y=f(x)
• y = sqrt(x)
• y-sqrt(x) = 1/2
• -2*y-sqrt(x) = 1/2
• y-sqrt(x) ≥ 1/2
• -2*y-sqrt(x) ≥ 1/2
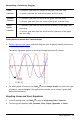
Equations and inequalities
equivalent to
x=g(y)
• x = sin(y)
• x-sin(y) = 1/2
• x-sin(y) ≥ 1/2
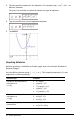
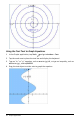
Polynomial equations and
inequalities
• x^2+y^2 = 5
• x^2-y^2 ≥ 1/2+y