
Application Guide
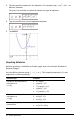

Relation type Examples
• x
3
+y
3
-6*x*y=0
The above relations on domains
restricted by rectangles
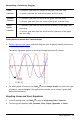
• y=sin(x) and
-2π<x≤2π
• y≤x
2
|y ≥ -2 and 0 ≤ x ≤ 3
• {x
2
+y
2
≤3, y ≥ 0 and x ≤ 0
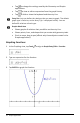
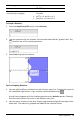
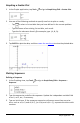
To Graph a Relation:
1. From the GraphEntry/Edit menu, select Relation.
2. Type an expression for the relation. You can touch and hold the "greater than" key
to select one of the relation operators.
3. Press Enter to graph the relation.
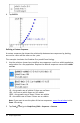
Tips for Graphing Relations
▶ You can quickly define a relation from the Function entry line. Position the cursor to
the immediate right of the = sign, and then tap the backspacekey .
A small menu appears with the relation operators and a Relation option. Choosing
from the menu places the cursor in the Relation entry line.
▶ You can type a relation as text on a Graphs page and then drag the text object over
either axis. The relation is graphed and added to the relation history.
Graphs Application 58