
Application Guide

Graphing a Scatter Plot
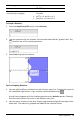
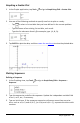
1. In the Graphs application, tap Tools and go to GraphEntry/Edit > Scatter Plot.
2. Use one of the following methods to specify two lists to plot as x and y.
- Tap to select a list variable that you have defined in the current problem.
- Type the name of an existing list variable, such as v1.
- Type the list elements directly (for example, type {1,2,3}.
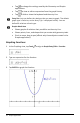
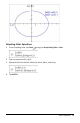
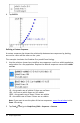
3. Tap ENTER to plot the data, and then zoom the work area to view the plotted data.
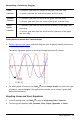
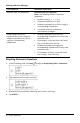
Plotting Sequences
Defining a Sequence
1. In the Graphing view, tap Tools and go to GraphEntry/Edit > Sequence >
Sequence.
2. Type the expression to define the sequence. Update the independent variable field
to m+1, m+2, etc., if necessary.
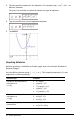
3. Type an initial term. If the sequence expression references more than one prior
term, such as u1(n-1) and u1(n-2), (or u1(n) and u1(n+1)), separate the terms with
commas.
Graphs Application 62