
Application Guide

63 Graphs Application
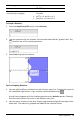
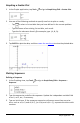
4. Tap ENTER.
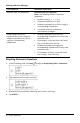
Defining a Custom Sequence
A custom sequence plot shows the relationship between two sequences by plotting
one on the xaxis and the other on the yaxis.
This example simulates the Predator-Prey model from biology.
1. Use the relations shown here to define two sequences: one for a rabbit population,
and another for a fox population. Replace the default sequence names with rabbit
and fox.
.05 = the growth rate of rabbits if there are no foxes
.001 = the rate at which foxes can kill rabbits
.0002 = the growth rate of foxes if there are rabbits
.03 = the death rate of foxes if there are no rabbits
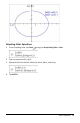
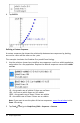
Note: If you want to see the plots of the two sequences, zoom the window to the
Zoom-Fit setting.
2. Tap Tools and go to GraphEntry/Edit > Sequence > Custom.