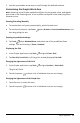
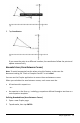
3. Specify the rabbit and fox sequences to plot on the x and y axes, respectively.
4. Tap ENTER to create the custom plot.
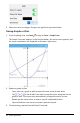
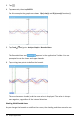
5. Zoom the window to the Zoom-Fit setting.
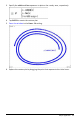
6. Explore the custom plot by dragging the point that represents the initial term.
Graphs Application 64