
Application Guide

73 Graphs Application
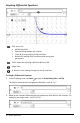
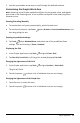
3. Tap .
4. Tap cos and x, then tap ENTER.
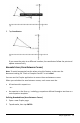
For this example the graph now shows f1(x)=sin(x) and f2(x)=cos(x) function(s).
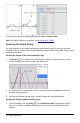
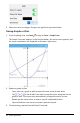
5. Tap Tools and go to Analyze Graph > Bounded Area.
The Bounded Area tool appears in the application Toolbar. You are
prompted to set the lower and upper bounds.
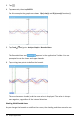
6. Tap or drag two points to define the bounds.
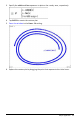
The area becomes shaded, and the area value is displayed. The value is always
non-negative, regardless of the interval direction.
Working With Shaded Areas
As you change the bounds or redefine the curves, the shading and the area value are