
Application Guide
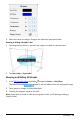


The keyboard and the entry line appear.
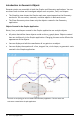
2. Type the equations that define the graph.
3. (Optional) Tap to set the 3D plotting parameters tmin, tmax, umin, and umax.
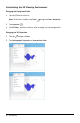
4. Tap ENTER to draw the graph and hide the entry line and keyboard. You can show
the entry line and keyboard anytime by tapping on the Graphs Toolbar.
3D Graphing 84