
Application Guide


109 Lists & Spreadsheet Application
4. Type any starting numbers required by the sequence in the Initial Terms field and
separate them with commas.
5. Type a starting value for the independent variable (n0), a maximum number of
values to be generated (nMax), and the step value (nStep).
Note: Type a maximum value for the sequence in the Ceiling Value field, if desired.
6. Tap OK.
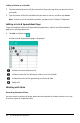
Graphing Spreadsheet Data
Creating a Scatter Plot with Quick Graph
1. Name both of the columns to declare them as lists, and then select both columns.
2. Tap Tools and go to Data> Quick Graph.
A Data & Statistics application is added to the page with the plotted data.
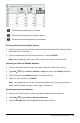
Creating a Summary Plot
Note: In this example, you create a summary table from raw data, and then use the
table to generate a summary plot.
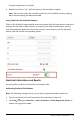
1. Create a list that holds the category identifiers. For this example, name the list
“color” and type strings for eye color.
2. Create the summary list. For this example, name the list “counts” and type the
total count for each of the eye colors.
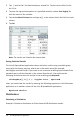
3. Select either list.
4. Tap Tools and go to Data> Summary Plot.
5. If necessary, change the lists for X List and Summary List.
6. In the Display On field, select how to display the summary plot in the Data &
Statistics application, and then tap OK.
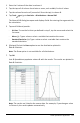
Capturing Data from Graphs or Geometry
1. Clear the columns you plan to use for the captured data.
2. Ensure that the data values you want to capture are linked to variable names.
3. Tap the column formula cell (the second cell from the top) of the column in which
you want to capture the values.
4. Tap Tools and go to Data > Data Capture > Automatic.