
Application Guide

111 Lists & Spreadsheet Application
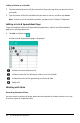
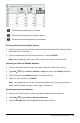
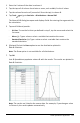
3. Tap next to the Y List box to display a named list. Tap the name of the list for
the Y List.
4. To store the regression equation in a specified variable, replace Save RegEqn To
with the name of the variable.
5. Tap the 1st Result Column box and type c[] as the column letter for the first result
column.
6. Tap OK.
Note: The results are linked to the source data.
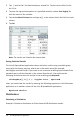
Storing Statistical Results
The Lists & Spreadsheet application stores statistical results using a variable-group
name with the format stat.nnn, where nnn is the result name (for example,
stat.RegEqn and stat.Resid). If you want to use a custom variable group instead of the
standard name, edit the formula in the column formula cell. You could use the
following formula to store the results in the variable group MystatsB.
=LinRegMx(a[],b[],1 ): CopyVar Stat., MystatsB.
Later, you could view the results by entering the following expression in the Calculator
application or in another column of the Lists & Spreadsheet application:
MystatsB.results
Distributions
Calculating a Distribution
Example: Calculate a distribution to fit the Normal Pdf distribution model.