
Application Guide

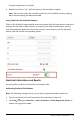

1. Enter the X values of the data in column A.
2. Tap the top cell of column A and enter a name, such as DD1, for the X values.
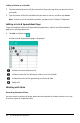
3. Tap the column formula cell (second cell from the top) in columnB.
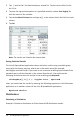
4. Tap Tools and go to Statistics > Distributions > Normal Pdf.
The Normal Pdf dialog box opens and displays fields for entering the arguments for
the calculation.
5. Tap each field and provide:.
- X Value: To use the list that you defined in step 2, tap the arrow and select the
list name.
- Mean (μ): Type a value or select a variable that contains the mean.
- Standard Deviation (σ): Type a value or select a variable that contains the
standard deviation.
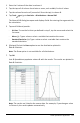
6. (Optional) Select the Draw option to see the distribution plotted in
Data&Statistics.
Note: The Draw option is not available for all distributions.
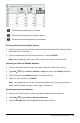
7. Tap OK.
Lists&Spreadsheet populates column B with the results. The results are plotted in
Data&Statistics.
Note: The results are linked to the source data. For example, if you change a value
in Column A, the result updates automatically.
Lists & Spreadsheet Application 112