
Application Guide


113 Lists & Spreadsheet Application
Supported Distribution Functions
The following distributions are available from the Lists&Spreadsheet application. For
more information regarding these functions, see the TI-Nspire™ Reference Guide.
• To return a single distribution result based on a single value, type the function in a
single cell.
• To return a list of distribution results based on a list of values, type the function in
a column formula cell. In this case, you specify a list (column) that contains the
values. For each value in the list, the distribution returns a corresponding result.
Note: For distribution functions that support the draw option (normPDF, tPDF,
χ²Pdf, and F Pdf), the option is available only if you type the distribution function
in a formula cell.
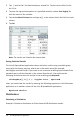
Normal Pdf (normPdf)
Computes the probability density function (pdf) for the normal distribution at a
specified x value. The defaults are mean μ=0 and standard deviation σ=1. The
probability density function (pdf) is:
This distribution is used to determine the probability of the occurrence of a certain
value in a normal distribution. The draw option is available when Normal PDF is
invoked from a formula cell.
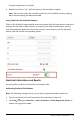
When you access distributions from the formula cell, you must select a valid list from
the drop-down list to avoid unexpected results. If accessed from a cell, you must
specify a number for the x-value. The distribution returns the probability that the value
you specify will occur.
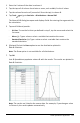
Normal Cdf (normCdf)
Computes the normal distribution probability between LowerBound and
UpperBound for the specified mean, μ (default=0) and the standard deviation, s
(default=1). You can click the Draw (Shade area) check box to shade the area between
the lower and upper bounds. Changes to the initial LowerBound and UpperBound
automatically update the distribution.