
Application Guide


Data & Statistics Application
The Data & Statistics Application enables teachers and students to create graphical
displays and perform analysis on data stored in lists. Defining (or naming) sets of data
using the Lists & Spreadsheet Application is the starting point for plotting and
analyzing data.
What You Can Do
• Work with sets of data in different types of plots.
• Work with sets of data in different types of charts.
• Manipulate variables to explore and visualize data relationships.
• Explore central tendency and other statistical summary techniques.
• Fit functions to data.
• Create regression lines for scatter plots.
• Graph hypothesis tests and results (z- and t-tests) based on summary statistics
definitions or data.
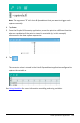
Tools Search
Tools Search allows you to search options and menus. It is available across all
applications in the TI-Nspire™ App.
Warning: Tools Search will allow you to search for menu items, but not for command
names.
What You Must Know
Plotting Variables
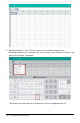
• Lists created in Lists &Spreadsheet can be accessed as a variable.
• Variables must be named before they can be used in Data &Statistics.
• Tap the Add Variable field located in the center of the x-axis or y-axis to choose a
defined variable name.
• The default plot for one variable is a dot chart. The data points in the default
caseplot reposition to represent the elements of the selected variable.
• The default plot for two variables is a scatter plot. The data points shift to
represent the elements of both variables on a scatter plot.
Rescaling the Axes
Pinch or spread either the horizontal or vertical axis to modify its scale.
Data & Statistics Application 122