Application Guide
Manuals
Brands
Texas Instruments Manuals
Calculators
Texas Instruments Nspire CX CAS Graphing Calculator, Frustration Free Package
671
672
673
674
675
676
677
678
679
680
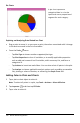
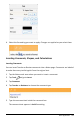
2.
Tap
the
a
dd
variable
reg
i
on
on
ea
ch
axi
s
to
view
defi
ned
varia
bles
.
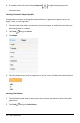
3.
Tap
the
varia
ble
nam
e
to
a
dd
i
t
to
the
s
el
ected
a
xis
to
crea
te
a
do
t
plot
(
f
req
uen
cy
plo
t)
.
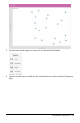
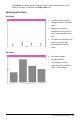
Data
&
Stat
istics
A
p
pli
cation 1
24
1
...
...
669
670
671
672
673
...
...
994