
Application Guide

127 Data & Statistics Application
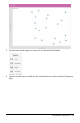
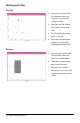
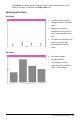
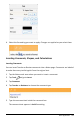
Scatter Plots
• Shows the relationship
between two sets of
numerical data.
• You also plot a scatter plot
using the Quick Graph tool
in the Lists &Spreadsheet
application.
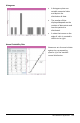
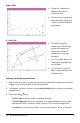
X-Y Line Plots
• This plot is a type of
scatter plot in which data
points are plotted and
connected in order of
appearance in the two
variables.
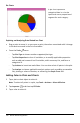
• An X-Y line plot depicts the
relationship between two
sets of data.
• The left-most column of
data is represented on the
horizontal axis.
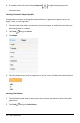
Exploring and Analyzing Plotted Data
• Drag a point to move it. As you move a point, the values associated with the point
change in the work area and in the list of variables.
• To change a variable on an axis, tap the Add Variable region, and then tap another
variable name.
• From the Tools menu:
- Tap Plot Type to select another supported plot type.
- Tap Plot Properties to clear all variables or to modify properties such as add
and remove X and Yvariables, add a summary list, or force a categorical X.
- Tap Actions to insert text or sliders. You can also select all points in the plot.