
Application Guide

129 Data & Statistics Application
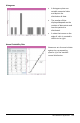
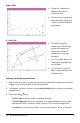
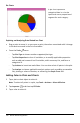
Pie Charts
A pie chart represents
categorical data in a circular
layout and uses a proportioned
segment for each category.
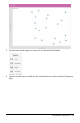
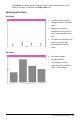
Exploring and Analyzing Data Plotted in a Chart
• Drag a point to move it. as you move a point, the values associated with it change
in the work area and in the list of variables.
• From the Tools menu:
- Tap Plot Type to choose another supported plot type.
- Tap Plot Properties to clear all variables, or to modify applicable properties
such as add and remove X and Y variables, add a summary list, and force a
categorical X.
- Tap Actions to insert text and sliders. You can also select all points in the plot.
- Tap Analyze to choose applicable analysis options such as adding a moveable
line, plotting a value or function, or activating the Graph Trace tool.
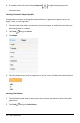
Adding Color to Plots and Charts
1. Tap a plot or chart object to select it.
Note:To select all points in a plot, tap Tools > Actions >Select All Points.
2. Tap Inspector , and then tap Fill Color.
3. Tap a color to select it.