
Application Guide

178 Alphabetical Listing
stat.CUpperList
stat.d
stat.ME
stat.MedianX
stat.Q1Y stat.SS
Note: Each time the Lists & Spreadsheet application calculates statistical results, it
copies the “stat.” group variables to a “stat#.” group, where # is a number that is
incremented automatically. This lets you maintain previous results while
performing multiple calculations.
stat.values
Catalog >
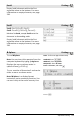
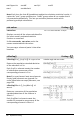
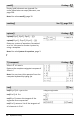
stat.values
Displays a matrix of the values calculated for
the most recently evaluated statistics
function or command.
Unlike stat.results, stat.values omits the
names associated with the values.
You can copy a value and paste it into other
locations.
See the stat.results example.
stDevPop()
Catalog >
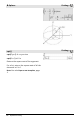
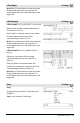
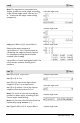
stDevPop(List [, freqList]) ⇒ expression
Returns the population standard deviation
of the elements in List.
Each freqList element counts the number
of consecutive occurrences of the
corresponding element in List.
Note:List must have at least two elements.
Empty (void) elements are ignored. For
more information on empty elements, see
page 236.
In Radian angle and auto modes:
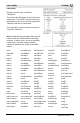
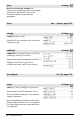
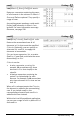
stDevPop(Matrix1[, freqMatrix]) ⇒
matrix
Returns a row vector of the population
standard deviations of the columns in
Matrix1.
Each freqMatrix element counts the
number of consecutive occurrences of the
corresponding element in Matrix1.