
User Manual


The TPA005D02 Audio Power Amplifier Evaluation Module
3-20
Details
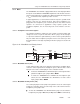
There is a minor power supply savings with a class D amplifier versus a linear
amplifier when amplifying sine waves. The difference is much larger when the
amplifier is used strictly for music. This is because music has much lower RMS
output power levels, given the same peak output power (Figure 3–15); and
although linear devices are relatively efficient at high RMS output levels, they
are very inefficient at mid-to-low RMS power levels. The standard method of
comparing the peak power to RMS power for a given signal is crest factor,
whose equation is shown below. The lower RMS power for a set peak power
results in a higher crest factor
Crest Factor 10 log
P
PK
P
rms
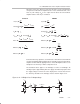
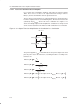
Figure 3–15. Audio Signal Showing Peak and RMS Power
Time
P
PK
Power
P
RMS
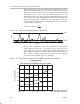
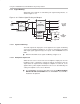
Figure 3–16 is a comparison of a 5-V class D amplifier to a similar linear
amplifier playing music that has a 13.76-dB crest factor. From the plot, the
power supply draw from a stereo amplifier that is playing music with a 13.76
dB crest factor is 1.02 W, while a class D amplifier draws 420 mW under the
same conditions. This means that just under 2.5 times the power supply is
required for a linear amplifier over a class D amplifier.
Figure 3–16. Audio Signal Showing Peak and RMS Power (with Music Applied)
600
500
300
200
100
0
400
1 1.5 2 2.5
Power Supplied (mW)
POWER SUPPLIED
vs
PEAK OUTPUT VOLTAGE AND PEAK OUTPUT POWER
4 4.53
3.5
0.25 0.56 1 1.56 4 5.062.25
3.06
Peak Output Voltage (V)
Peak Output Power (W)
TPA0202
TPA005D02