
Datasheet
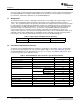


2.2 Efficiency
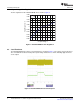
V =3.3V
O
0 0.5
I -OutputCurrent- A
O
95
100
Efficiency-%
V =8V
IN
V =12V
IN
V =15V
IN
V =18V
IN
90
85
80
75
70
65
60
0.25 0.75 1 1.25 1.5 1.75 2
Test Setup and Results
www.ti.com
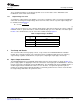
Table 4. EVM Connectors and Test Points
Reference Designator Function
J1 V
IN
(see Table 1 for V
IN
range)
J2 2-pin header for enable. Connect EN to ground to disable, open to enable.
J3 2-pin header for slow start monitor and GND.
J4 V
OUT
, 3.3 V at 2 A maximum
TP1 V
IN
test point at V
IN
connector
TP2 GND test point at V
IN
TP3 PH test point
TP4 Test point between voltage divider network and output. Used for loop response measurements.
TP5 Output voltage test point at OUT connector
TP6 GND test point at OUT connector
The efficiency of this EVM peaks at a load current of about 0.5 A - 1 A and then decreases as the load
current increases towards full load. Figure 1 shows the efficiency for the TPS54233EVM-373 at an
ambient temperature of 25 ° C.
Figure 1. TPS54233EVM-373 Efficiency
Figure 2 shows the efficiency for the TPS54233EVM-373 at lower output currents between 0.01 A and
0.20 A at an ambient temperature of 25 ° C.
4 TPS54233EVM-373 2-A, SWIFT™ Regulator Evaluation Module SLVU264 – November 2008
Submit Documentation Feedback