
Datasheet

71
72
73
74
75
76
77
78
79
80
81
82
83
84
85
86
87
88
1 10 100 1000
Efficiency-%
I -LoadCurrent-mA
O
L =muRataLQM21PN1R0
L =muRataLQM21PN0R54
V =3.6V
V =1.2V
PFM/PWMOperation
I
O
L = Aircoil(0.5 H,DCR=20m )m W
0
10
20
30
40
50
60
70
80
90
100
Efficiency-%
0.1 1 10 100 1000
I -LoadCurrent-mA
O
V =2.7V
PFM/PWMOperation
I
V =3.6V
PFM/PWMOperation
I
V =4.2V
PFM/PWMOperation
I
V =3.6V
ForcedPWMOperation
I
V =1.2V
O
0
10
20
30
40
50
60
70
80
90
100
Efficiency-%
0.1 1 10 100 1000
I -LoadCurrent-mA
O
V =1.2V
O
V =2.7V
PFM/PWMOperation
I
V =3.6V
PFM/PWMOperation
I
V =4.2V
PFM/PWMOperation
I
V =3.6V
ForcedPWMOperation
I
0.1 1 10 100 1000
I -LoadCurrent-mA
O
0
10
20
30
40
50
60
70
80
90
100
Efficiency-%
V =1.8V
O
V =2.7V
PFM/PWMOperation
I
V =3.6V
PFM/PWMOperation
I
V =4.2V
PFM/PWMOperation
I
V =3.6V
ForcedPWMOperation
I
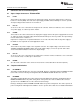
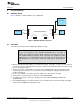
TPS626xxEVM Test Data
www.ti.com
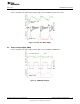
6 TPS626xxEVM Test Data
Figure 5 through Figure 11 present typical performance graphs for the TPS626xxEVM. Actual
performance data can be affected by measurement techniques and environmental variables; therefore,
these curves are presented for reference and may differ from actual results obtained by some users.
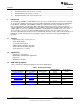
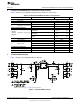
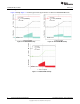
6.1 Efficiency
Figure 3 through Figure 8 show the typical efficiency performance for the TPS626xxEVM.
Figure 3. TPS6262xEVM Efficiency versus Load Figure 4. TPS6262x and TPS6262xEVM Efficiency
Current (VIN = 2.7 V) versus Load Current (VIN = 3.6 V)
Figure 5. TPS6261xEVM Efficiency versus Load Figure 6. TPS6261xEVM Efficiency versus Load
Current (V
OUT
= 1.8 V) Current (V
OUT
= 1.2 V)
6
TPS6261x/TPS6262x/TPS6266xEVM SLVU292A–April 2010–Revised April 2010
Copyright © 2010, Texas Instruments Incorporated