
Datasheet
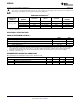
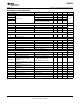
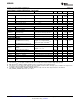
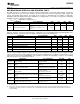


Table Of Contents
- FEATURES
- APPLICATIONS
- DESCRIPTION
- ELECTRICAL SPECIFICATIONS
- ABSOLUTE MAXIMUM RATINGS
- RECOMMENDED OPERATING CONDITIONS
- ELECTRICAL CHARACTERISTICS
- ADC MONITORING INTERVALS AND RESPONSE TIMES
- HARDWARE FAULT DETECTION LATENCY
- PMBus/SMBus/I2C
- I2C/SMBus/PMBus Timing Characteristics
- FUNCTIONAL OVERVIEW
- PMBus Interface
- Resistor Programmed PMBus Address Decode
- JTAG Interface
- Bias Supply Generator (Series Regulator Controller)
- Power On Reset
- External Reset
- Output Voltage Adjustment
- Analog Front End (AFE)
- Digital Compensator
- DPWM Engine
- Flexible Rail/Power Stage Configuration
- DPWM Phase Distribution
- DPWM Synchronization
- Phase Shedding at Light Current Load
- Phase Adding at Normal Current Load
- Output Current Measurment
- Output Current Balancing
- Overcurrent Detection
- Current Foldback Mode
- Input Voltage and Current Monitoring
- Temperature Monitoring
- Temperature Balancing
- Soft Start, Soft Stop Ramp Sequence
- Input UV Lockout
- Voltage Tracking
- Sequencing
- Fan Control
- Non-volatile Memory Error Correction Coding
- APPLICATION INFORMATION

ADC MONITORING INTERVALS AND RESPONSE TIMES
UCD9240
www.ti.com
................................................................................................................................................... SLUS766C – JULY 2008 – REVISED NOVEMBER 2008
The ADC operates in a continuous conversion sequence that measures each rail ' s output voltage, each power
stage ' s ouput current, plus four other variables (external temperature, Internal temperature, input voltage and
current, and tracking input voltage). The length of the sequence is determined by the number of output rails
(NumRails) and total output power stages (NumPhases) configured for use. The time to complete the monitoring
sampling sequence is give by the formula:
t
ADC_SEQ
= t
ADC
× (NumRAILS + NumPHASE + 4)
PARAMETER TEST CONDITIONS MIN TYP MAX UNIT
t
ADC
ADC single-sample time 3.84 µ s
Min = 1 Rail + 1 Phase + 4 = 6
samples
t
ADC_SEQ
ADC sequencer interval 23.04 61.44 µ s
Max = 4 Rails + 8 Phases + 4 = 16
samples
The most recent ADC conversion results are periodically converted into the proper measurement units (volts,
amperes, degrees), and each measurement is compared to its corresponding fault and warning limits. The
monitoring operates asynchronously to the ADC, at intervals shown in the table below.
PARAMETER TEST CONDITIONS MIN TYP MAX UNIT
t
Vout
Output voltage monitoring interval 200 µ s
200 ×
t
Iout
Output current monitoring interval µ s
N
Rails
t
Vin
Input voltage monitoring interval 2 ms
t
Iin
Input current monitoring interval 2 ms
t
TEMP
Temeprature monitoring interval 800 ms
t
Ibal
Output current balancing interval 2 ms
t
FanTach
Fan speed monitoring interval 1000 ms
Because the ADC sequencer and the monitoring comparisons are asynchronous to each other, the response
time to a fault condition depends on where the event occurs within the monitoring interval and within the ADC
sequence interval. Once a fault condition is detected, some additional time is required to determine the correct
action based on the FAULT_RESPONSE code, and then to perform the appropriate response. The following
table lists the worse-case fault response times.
PARAMETER TEST CONDITIONS MAX TIME UNIT
Over/under voltage fault response time during Normal regulation, no PMBus activity,
t
OVF
, t
UVF
300 µ s
normal operation 8 stages enabled
Over/under voltage fault response time, during data During data logging to nonvolatile
t
OVF
, t
UVF
800 µ s
logging memory
(1)
Over/under voltage fault response time, when
t
OVF
, t
UVF
During tracking and soft-start ramp. 400 µ s
tracking or sequencing enable
Normal regulation, no PMBus activity,
Over/under current fault response time during
(2)
100 + (600 x
t
OCF
, t
UCF
8 stages enabled µ s
normal operation N
Rails
)
75% to 125% current step
During data logging to nonvolatile
Over/under current fault response time, during data 600 + (600 x
t
OCF
, t
UCF
memory µ s
logging N
Rails
)
75% to 125% current step
Over/under current fault response time, when During tracking and soft start ramp 300 + (600 x
t
OCF
, t
UCF
µ s
tracking or sequencing enable 75% to 125% current step N
Rails
)
Temperature rise of 10 ° C/sec, OT
t
OTF
Overtemperature fault response time 5 s
threshold = 100 ° C
(1) During a STORE_DEFAULT_ALL command, which stores the entire configuration to nonvolatile memory, the fault detection latency can
be up to 10 ms.
(2) Because the current measurement is averaged with a smoothing filter, the response time to an Overcurrent condition depends on a
combination of the time constant ( τ ) from Table 4 , the recent measurement history, and how much the measured value exceeds the
overcurrent limit.
Copyright © 2008, Texas Instruments Incorporated Submit Documentation Feedback 5
Product Folder Link(s): UCD9240