
User's Manual


168
Chapter 9: Function Graphing
7309ENG.DOC CH 9 Function Graphing, English Julie Hewlett Revised: 07/29/98 12:14 PM Printed: 05/19/99
9:01 AM Page 168 of 24
Editing FunctionsEditing Functions
You can edit or delete functions at any time in the Y= editor.
Move the cursor to the function in the Y= editor that you want
to change.
You can:
• Use the edit keys such as / and - m to delete and
insert characters.
• Overwrite current entries.
• Delete a function with :. Position the cursor
anywhere on the function.
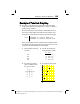
Selecting FunctionsSelecting Functions
Even if a function is defined in the Y= editor, the TIN73 only
graphs the function if it is selected (turned on). You know that
a function is selected because the background behind a
functions equal sign (
=
) is dark.
When you first define a function, it is selected automatically.
To select or deselect a function,
highlight its
=
using the cursor
keys, and then press b.
You can change the on/off status of a statistical plot in the
Y= editor. To select or deselect
Plot1
,
Plot2
, or
Plot3
, highlight
the name (across the top of the Y= editor) using the cursor
keys, and then press b. A plot is selected (on) if the
background behind its name is dark.
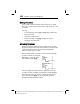
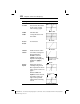
Y
2
is selected.
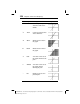
Y
2
is deselected.