
User's Manual


Chapter 9: Function Graphing
177
7309ENG.DOC CH 9 Function Graphing, English Julie Hewlett Revised: 07/29/98 12:14 PM Printed: 05/19/99
9:01 AM Page 177 of 24
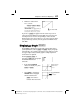
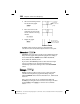
7. Find the Y values when
X= 2, 4, and 5.
2
b
4
b
5
b
Note: Consider using the
CONVERSIONS
menu (
-
‚
4
)
to convert your answers (in minutes) to
seconds, hours, days, weeks, or years.
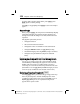
If you trace ()) the graph with the cursor keys to an X
value greater than
Xmax
or less than
Xmin
, the cursor goes off
the Graph screen, but the corresponding Y values are still
displayed since they exist. However, you cannot enter X values
(as you did in step 7 above) that are greater than
Xmax
or less
than
Xmin
.
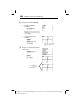
Displaying a Graph *
Press * to display the graph of the selected function(s).
(Some operations, such as ) and (, display the graph
automatically.) As a graph is plotted, the busy indicator comes
on (upper right corner) until the graph is completely drawn
and X and Y are updated.
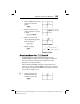
Pressing *, ), or
selecting a ( function graphs
all defined and selected
functions.
• If the desired
WINDOW
values are already set, press
* or ).
• Press ( to change the
WINDOW
values and graph
all selected functions.
( , then select a
function from the menu
When
X=4
,
Y=200
.
Standard default
window values
are set.
(
6:ZStandard
is selected.