
User's Manual


Chapter 9: Function Graphing
183
7309ENG.DOC CH 9 Function Graphing, English Julie Hewlett Revised: 07/29/98 12:14 PM Printed: 05/19/99
9:01 AM Page 183 of 24
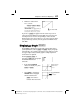
2. Select the
ZBox
function and
return to the function
graph.
(
1
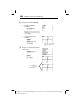
3. Move the cursor to one
corner of the box you want
to define.
"!$#b
4. Move the cursor to the
corner diagonally opposite
from the first one.
"!$#
5. Replot the graph.
b
Zoom In and Zoom Out Zoom In and Zoom Out
(
2 and 3 2 and 3
Zoom In
magnifies the graph around the cursor location.
Zoom Out
displays a greater portion of the graph, centered on
the cursor location, to provide a more global view. (The
procedure is the same for both.)
After a
Zoom In
or
Zoom Out
operation is selected, move the
cursor, as necessary, and press b to select the new center
point. Repeat the operation until another operation is selected
or you exit the Graph screen.
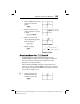
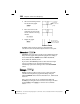
1. Display the graph of a
selected function (the
example shows
Y
1
=X
2
).
(
6
³
The cursor is in the
center of the new screen.
Cursor changes
to a small square.