
User's Manual


296
Appendix A: Function and Instruction Reference
73A-ENG.DOC AppxA: Function/Instruction Reference, English Julie Hewlett Revised: 07/29/98 1:10 PM Printed:
05/19/99 9:03 AM Page 296 of 36
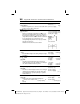
Manual-Fit [Y
]
-v
CALC
Allows you to fit manually a line to plotted data. The
regression equation is stored to Y
, if specified.
{1,3,4,5,5,7,8,9}
Ü
L
3
b
Done
{1,4,2,3,4,6,7,9}
Ü
L
4
b
Done
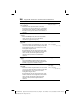
Set up Plot1 as a scatter plot
and graph using ZStat:
Return to the Home screen an
d
select Manual-Fit.
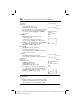
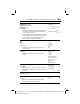
max(valueA,valueB)
1
NUM
o r
-v
MATH
Returns the larger of two values or the largest
element in one list. value can be a real number,
expression or a list.
If both values are lists, they must have the same
number of elements. If one value is a list and the
other a non-list, the non-list is paired with each
element of the list, and a list is returned.
max(2.3,1.4)
b
2.3
max({1,3,6})
b
6
max({1,10},{2,9})
b
{2 10}
max(
2
3
,
3
4
)
3
4
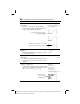
mean(list[,freq])
-v
MATH
Returns the mean (mathematical average) of list. If a
second list, freq, is specified, it is interpreted as the
frequency of the elements in the first list. list and freq
must have the same number of elements.
mean({1,2,3,4})
b
2.5
mean({1,2,3,4},{4,5,4,6})
b
2.631578947
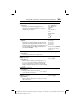
Select beginning and ending
points of line by moving the
cursor and then pressing
b
.