
Operation Manual
29
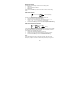
The icons display weather forecasts in terms of getting better or worse, and
not necessarily sunny or rainy as each icon indicates. For example, if the
current weather is cloudy and the rainy icon is displayed, it does not mean that
the product is faulty because it is not raining. It simply means that the air
pressure has dropped and the weather is expected to get worse but not
necessarily rainy.
Note:
After setting up, readings for weather forecasts should be disregarded for the
next 12-24 hours. This will allow sufficient time for the Weather Station to
collect air pressure data at a constant altitude and therefore result in a more
accurate forecast.
Common to weather forecasting, absolute accuracy cannot be guaranteed.
The weather forecasting feature is estimated to have an accuracy level of
about 75% due to the varying areas the Weather Station has been designed
for use in. In areas that experience sudden changes in weather (for example
from sunny to rain), the Weather Station will be more accurate compared to
use in areas where the weather is stagnant most of the time (for example
mostly sunny).
If the weather station is moved to another location significantly higher or lower
than its initial standing point (for example from the ground floor to the upper
floors of a house), remove the batteries and re-insert them after about 30
seconds. By doing this, the Weather Station will not mistake the new location
as being a possible change in air-pressure when really it is due to the slight
change of altitude. Again, disregard weather forecasts for the next 12 to 24
hours as this will allow time for operation at a constant altitude.
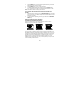
THE WEATHER TENDENCY INDICATOR
Working together with the weather icons are the weather tendency indicators
(located on the left and right hand side of the weather icons). When the
indicator points upwards, it means that the air-pressure is increasing and the
weather is expected to improve, but when indicator points downwards, the air-
pressure is dropping and the weather is expected to become worse.
Taking this into account, you will see how the weather has changed and how it
is expected to change. For example, if the indicator is pointing downwards