
User's Manual


86
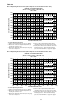
Table 4-6 (Continued)
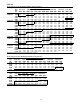
30 Ton Operating Pressure Curve (All Compressors and Condenser Fans "On")
COOLING CYCLE PRESSURE CURVE
(Based on Indoor Airflow of 400 CFM / Ton)
FULL LOAD
180
200
220
240
260
280
300
320
340
360
380
50 55 60 65 70 75 80 85 90 95 100
SUCTION PRESSURE, PSIG
DISCHARGE PRESSURE, PSIG
105 F OD Ambient
95 F OD Ambient
85 F OD Ambient
75 F OD Ambient
65 F OD Ambient
To Check Operating Pressures
1. Start the unit and allow the pressures to stabilize.
2. Measure the outdoor air dry bulb temperature (F)
entering the condenser coil.
3. Measure the discharge and suction pressure (psig)
next to the compressor.
4. Plot the outdoor dry bulb temperature and the
operating suction pressure (psig) onto the chart.
5. At the point of intersection, read to the left for the
discharge pressure. The measured discharge
pressure should be within ± 7 psig of the graph.
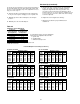
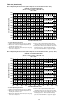
40 Ton Operating Pressure Curve (All Compressors and Condenser Fans, per ckt, "On")
COOLING CYCLE PRESSURE CURVE
(Based on Indoor Airflow of 400 CFM / Ton)
FULL LOAD
180
200
220
240
260
280
300
320
340
360
380
50 55 60 65 70 75 80 85 90 95 100
SUCTION PRESSURE, PSIG
DISCHARGE PRESSURE, PSIG
105 F OD Ambient
95 F OD Ambient
85 F OD Ambient
75 F OD Ambient
65 F OD Ambient
To Check Operating Pressures
1. Start the unit and allow the pressures to stabilize.
2. Measure the outdoor air dry bulb temperature (F)
entering the condenser coil.
3. Measure the discharge and suction pressure (psig)
next to the compressor.
4. Plot the outdoor dry bulb temperature and the
operating suction pressure (psig) onto the chart.
5. At the point of intersection, read to the left for the
discharge pressure. The measured discharge
pressure should be within ± 7 psig of the graph.