
Manual

Insight 360 Teacher App 17
individual question and can be displayed on the classroom computer desktop.
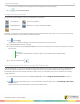
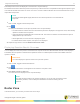
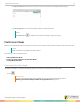
The Student Performance Table lists question responses by student name and is compatible with all supported question types.
Icons indicate whether each answer is correct or incorrect. A series of dashes indicates that a connected student has not yet
responded to the question.
NOTE
The chart and table appear slightly different for short answer questions to accommodate the
responses.
1
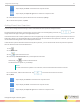
Start a Verbal, Tagged or ExamView question.
2
Tap .
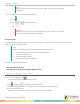
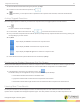
The Response Distribution Chart opens by default on the computer desktop.
l The total number of students who have answered the question is displayed in the upper-left corner; automatically
updates as students enter responses.
l Options are displayed in alphabetical or numerical order. The number of students who selected each option is
displayed at the top of the column.
l Where applicable, the correct answer is displayed in green.
l If students did not select an option, that option is not displayed.
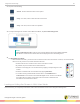
3
Swipe from right to left to view the Student Performance Table.
Displaying Question Results On-screen
You can display the results of a question on the classroom computer screen from Question Mode. Results can be displayed
immediately after the question is started and are updated in real-time. Individual question results are available until a new
question is started.
IMPORTANT
You cannot display the question results from a previous question.
1
Start a Verbal, Tagged or ExamView Question.
2
Tap .
The Response Distribution Chart appears on the classroom computer screen.
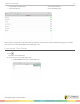
3
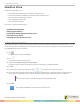
Slide Show Correct from Off to On.
The correct answer is displayed on the computer desktop.
NOTE
The chart will refresh when a new question is asked. If you do not want the real-time results
viewable by students, close the Response Distribution Chart before starting the next
question.
Roster Zone
In the Roster Zone, you can view your class roster in four ways:
turningtechnologies.com/user-guides