Office 2007 TurningPoint for Office 2007 User Guide 1
© 2013 Turning Technologies, LLC. Portions Responsive Innovations, LLC, Microsoft Corporation No part of this document may be reproduced or transmitted in any form or by any means, electronic or mechanical, for any purpose, without the express written permission of Turning Technologies, LLC. All rights reserved. Turning Technologies, LLC, 255 West Federal Street, Youngstown, OH 44503 USA. TurningPoint® is a registered trademark of Turning Technologies, LLC.
1 About TurningPoint . . . . . . . . . . . . . . . . . . . . . . . . . . . . . . .7 Product Introduction. . . . . . . . . . . . . . . . . . . . . . . . . . . . . . . . . . . . . . . . . . . . . . 8 System Requirements . . . . . . . . . . . . . . . . . . . . . . . . . . . . . . . . . . . . . . . . . . . . . 9 Requirements for Hardware . . . . . . . . . . . . . . . . . . . . . . . . . . . . . . . . . . . . 9 Requirements for Software . . . . . . . . . . . . . . . . . . . . . . . . . . . . . . . . . . . . .
Set Point Values on a TurningPoint Slide . . . . . . . . . . . . . . . . . . . . . . . 89 Clear Answer Values from the Settings Window . . . . . . . . . . . . . . . . 91 Clear Answer Values on a TurningPoint Slide. . . . . . . . . . . . . . . . . . . 92 Use Speed Scoring . . . . . . . . . . . . . . . . . . . . . . . . . . . . . . . . . . . . . . . . . . . . 95 Create Picture Slides . . . . . . . . . . . . . . . . . . . . . . . . . . . . . . . . . . . . . . . . . . 96 Change Chart Colors . . . . . . . . . .
Real-Time Registration Tool . . . . . . . . . . . . . . . . . . . . . . . . . . . . . . . . . . . . .175 How to Use the Real-Time Registration Tool. . . . . . . . . . . . . . . . . . .175 6 Tools . . . . . . . . . . . . . . . . . . . . . . . . . . . . . . . . . . . . . . . . . . 178 Ranking Wizard . . . . . . . . . . . . . . . . . . . . . . . . . . . . . . . . . . . . . . . . . . . . . . . . .179 Create Slides with the Ranking Wizard . . . . . . . . . . . . . . . . . . . . . . . .180 Standards. . . . . . .
Other Reports. . . . . . . . . . . . . . . . . . . . . . . . . . . . . . . . . . . . . . . . . . . . .247 9 Sessions . . . . . . . . . . . . . . . . . . . . . . . . . . . . . . . . . . . . . . . 250 Manage and Edit Sessions. . . . . . . . . . . . . . . . . . . . . . . . . . . . . . . . . . . . . . .251 Save Results from a Session . . . . . . . . . . . . . . . . . . . . . . . . . . . . . . . . . .251 Change the Default Save Location . . . . . . . . . . . . . . . . . . . . . . . . . . . .
1 About TurningPoint Welcome to TurningPoint, the easiest, most powerful, fully interactive group response system available. For use with PowerPoint, TurningPoint enables an audience to use response devices to provide instant feedback to a speaker. TurningPoint then gathers the responses and quickly translates the results into test scores, charts, and graphs. It also can store the data for future reference.
Product Introduction Product Introduction TurningPoint smoothly integrates with PowerPoint to create a more interactive and memorable presentation. TurningPoint was designed to run on Office 2003, Office 2007 and Office 2010. (Find additional information in System Requirements on page 9.) Once installed, TurningPoint options are accessed through the TurningPoint Ribbon, which can be found in PowerPoint beneath the standard PowerPoint Ribbon.
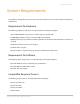
System Requirements System Requirements TurningPoint is designed to function on most computers; however, there are some hardware and software requirements: Requirements for Hardware The following hardware specifications are required before installing TurningPoint: • Intel or AMD 600 MHz class processor (1 GHz or higher recommended) • 256 MB RAM (256 MB or more of “available” RAM recommended) • 60 MB hard disk space (an additional 32 MB is required if you do not have Microsoft .NET Framework 2.
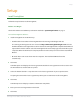
Setup Setup Install TurningPoint Follow the steps below to install TurningPoint. Before You Begin Check the hardware and software specifications outlined in System Requirements on page 9. To install TurningPoint software… 1 Install TurningPoint in one of two ways: • Download the latest edition of TurningPoint from the Turning Technologies web site. The Turning Technologies web site is located at http://www.turningtechnologies.com.
Configure Automatic Updates A window opens and displays a message that the computer is ready to install TurningPoint. 7 Click Install. The computer installs TurningPoint and displays the Finish button on the page when the process is complete. 8 Click Finish. Select the Launch TurningPoint checkbox if you would like to immediately open the program or double-click the TurningPoint shortcut on the desktop to open the program.
Open TurningPoint with PowerPoint 3 Click Update. Tip Check the box labeled “Automatically check for updates in the future” to have TurningPoint check for updates each time the application is opened. 4 TurningPoint will download the update. 5 When prompted, close PowerPoint. After the updated has been downloaded and installed, TurningPoint will reopen. Open TurningPoint with PowerPoint After you install TurningPoint, you can configure it to open automatically when PowerPoint starts.
Open TurningPoint with PowerPoint A drop-down menu opens. Settings Window: Add-In always loaded 6 Choose either True or False. Choosing True will have TurningPoint automatically load when PowerPoint is opened. Choosing False means that TurningPoint does NOT automatically load when PowerPoint is opened; you must launch TurningPoint by using the TurningPoint.exe shortcuts created at the time of installation. Note TurningPoint uses False as the default setting for Add-In always loaded. 7 Click Done.
Tour of the TurningPoint Ribbon Tour of the TurningPoint Ribbon When you launch TurningPoint, PowerPoint opens and the TurningPoint Ribbon can be accessed by selecting the TurningPoint 2008 tab, as the following image depicts: TurningPoint Ribbon The following descriptions define the buttons that make up the tools in the TurningPoint 2008 Ribbon: Information Allows you to view information about your TurningPoint Software.
Tour of the TurningPoint Ribbon Convert to Picture Slide Insert Object Tools Select Input Source Participants Assigns pictures as answers in place of text. Find information about picture slides in Chapter 3: Creating and Saving Slides. Displays a menu of items to enhance a TurningPoint slide. Find information about slide options in Chapter 3: Creating and Saving Slides. Displays a menu of options to report, modify, track, and integrate TurningPoint presentations and sessions.
Customer Support Resources Customer Support Resources If you have questions or concerns, additional resources are available online or by calling a Turning Technologies representative. Online Assistance Turning Technologies offers online assistance through its web site at http://www.turningtechnologies.com. Go to the Product Guides and Manuals section of the web site to find more information about using TurningPoint, such as the Quick Start Guide.
2 Getting Started with TurningPoint The process to create interactive presentations with TurningPoint is very simple. This chapter describes how to successfully build, deliver, and save the results of an interactive presentation in five easy steps.
Five Steps to Presentation Success Five Steps to Presentation Success Creating an interactive presentation with TurningPoint can be accomplished in five easy steps. Note The steps below outline the suggested approach to presentation success; however, you are not required to perform the steps in this order, and you may omit steps that do not apply to you.
Step One: Create Presentation Slides As you move your cursor over the entries in the Insert Slide menu, the slide name is highlighted. Find more information on slides in Types of Slides on page 39. Insert Slide 2 Select Vertical Slide.
Step One: Create Presentation Slides TurningPoint inserts a Vertical Slide. The slide contains a question, answer, and chart region. Insert Vertical Slide Question region - “Enter question text...” Answer region - “Enter answer text...” Chart region - This example is a vertical bar chart. Charts can be positioned anywhere on the slide. 3 Select the Question region and type a question. When you select the region, the text is highlighted. The highlighted text is replaced with the question that you enter.
Step Two: Set Up the Response Devices Next Steps Slides can be customized with a variety of animated feedback mechanisms. Find more information about these objects and other features in Chapter 3: Creating and Saving Slides. Step Two: Set Up the Response Devices Each audience participant uses a response device to respond to the questions asked during the presentation. TurningPoint supports a variety of response devices including infrared and radio frequency ResponseCards as well as ResponseWare.
Step Two: Set Up the Response Devices If you are using a response device licensed for TurningPoint 2003 or 2006, you must upgrade the license code for the receiver. Contact your Account Executive to receive a new license code for TurningPoint version 4.0 and higher. 2 If required, Upgrade your Response Device. Otherwise, go step 3. If you have not already upgraded your response device receiver, you must complete this step. a From the TurningPoint Ribbon, select Tools > Upgrade TurningPoint Receiver.
Step Two: Set Up the Response Devices The TurningPoint Settings window opens, displaying two tabs: Settings and Polling Test. Settings Window 4 Select the Settings tab. The Settings tab displays a Settings Hierarchy in the left pane and the available settings in the right pane. 5 Select Response Device from the Settings Hierarchy.
Step Two: Set Up the Response Devices Settings for the Response Devices display in the right pane of the Settings window. Select All Settings to access additional settings. Settings Window: Response Devices Note ResponseWare is a software version of a response device. ResponseWare must be identified for use during device setup as well. Find more information on device setup in Chapter 4: Response Device and Settings Management. 6 Enter the number of expected devices.
Step Two: Set Up the Response Devices Next Steps Find more information about Response Devices and the Settings available in the TurningPoint User Guide in Chapter 4: Response Device and Settings Management. If an audience member’s device is not being accepted, check the device’s ability to communicate. Radio Frequency and ResponseWare response devices provide on-screen confirmation that responses have been received.
Step Two: Set Up the Response Devices TurningPoint is now ready to accept responses from the response devices. You can magnify the responses by placing a check mark in the box next to Magnify Values. Polling Test: Magnify Responses 4 Press a key on each response device to be used. TurningPoint displays the Device ID, Channel, and the key entry from each response device in the order in which they were tested. Polling Test: Response Device Test 5 Click End Test. 6 Click Done.
Step Three: Create a Participant List Step Three: Create a Participant List Participant Lists identify the members of the audience—students, trainees, survey respondents—who will use a response device during the presentation. The participant name and required information is stored along with the Device ID. You may create multiple Participant Lists to be used with one interactive presentation. Doing so allows you to use the presentation with multiple audiences and track the session results per audience.
Step Three: Create a Participant List If you opted to create a new template, TurningPoint asks you to name the template. Enter a name and select the OK button. Custom Template Name TurningPoint displays the Participant List information entries (called fields). All entries that make up the template appear in the Selected Fields region on the right. Use this page to add, delete, or reorder the entries that make up the template.
Step Three: Create a Participant List TurningPoint displays the Groups entry box. Use this screen to add groups to your Participant List. Groups provide categorization for team competitions and greater reporting opportunities. Participant List Wizard: Add Groups 6 Optionally, enter a group name and click Add. Tip Make sure you select any groups that you want to include in team competitions. TurningPoint displays all groups in the Included Groups box.
Step Three: Create a Participant List TurningPoint displays the Participant List summary screen. Participant List Wizard: Summary 8 Optionally, edit the Participant File composition. The settings you can change include the Participant List file name, number of fields, and number of groups. For file name, select the old file name and enter a new one in the box provided. For number of fields or number of groups, select the link next to the setting to be returned to the screen and make your edits.
Step Four: Run a Presentation Session 10 Optionally, add names and other participant information to the new Participant List. Participant Information 11 Click Done to close the Participant Information window. Next Steps Find more information about Participant Lists in Chapter 5: Track Participants and Teams. Step Four: Run a Presentation Session TurningPoint uses PowerPoint’s Slide Show capabilities to present the interactive slides that have been created.
Step Four: Run a Presentation Session 2 From the TurningPoint Ribbon, select the Response Device menu and select the device to be used. TurningPoint allows you to select how responses will be provided during the presentation. Your choices are: Select Response Devices • Response Devices—a response device will be used during the presentation. The response devices must be configured in Settings prior to use. Find more information on response devices in Install Devices on page 121.
Step Four: Run a Presentation Session 4 From the TurningPoint Setting Pane, select the Participant List to be used. Participant List Selection 5 From the PowerPoint Ribbon, select the Slide Show tab. A menu of slide show options displays. 6 In the Start Slide Show section, select From Beginning. The first slide of the presentation is shown. 7 Use the left mouse button to control the progress of the slide show.
Step Five: Save Session Results b Advancing to the next slide will close polling and display results. c Advance to the next slide to continue presentation. Next Steps Your presentation may have additional features, such as animation, that cause it to behave differently at runtime from the default behavior. Find more information in Chapter 7: Run Presentations.
Step Five: Save Session Results 4 From the TurningPoint Ribbon, select Reset > Session. Reset Sessions TurningPoint clears the existing session results and allows you to run the presentation again to capture new results. Note TurningPoint prompts you to save existing session results when you reset the session and when you exit from TurningPoint without previously saving. Next Steps You are able to run reports to review responses provided by each participant during a session.
3 Creating and Saving Slides In Chapter 2: Getting Started with TurningPoint, you learned the basic steps for creating TurningPoint presentations. This chapter expands on those steps and details the powerful features of TurningPoint.
Creating Slides Creating Slides There are two ways to create a slide: • Insert a TurningPoint template slide using the Insert Slide menu. • Convert an existing PowerPoint slide into a TurningPoint slide. Insert a Slide To insert a slide into a presentation… 1 Open TurningPoint. 2 Open a presentation or create a new presentation. 3 Click Insert Slide on the TurningPoint Ribbon. 4 Select the slide type from the Insert Slide menu. • TurningPoint inserts the new slide into the presentation.
Creating Slides Save the Presentation Slides Since TurningPoint slides are native PowerPoint slides, they are saved as part of the presentation file (.pptx). This file can be shared with other TurningPoint and PowerPoint users. Note The presentation can safely be opened on computers without TurningPoint installed. Do not edit the TurningPoint slides on a computer without TurningPoint installed. Otherwise, the slides may not function properly the next time the interactive presentation is run.
Types of Slides Types of Slides The Insert Slide menu on the TurningPoint Ribbon lists all of the slides that can be inserted into a presentation. Chart Slides The first seven slides on the Insert Slide menu insert a template slide with a chart of the specified type: Vertical, Horizontal, 3D Pie, Distributed Pie, Offset, Doughnut, or Responses Only. The chart shows the results of the audience’s choices for each answer.
Types of Slides Vertical Slide The vertical slide contains a bar chart with vertical bars for each answer. Vertical Slide Horizontal Slide The horizontal slide contains a bar chart with horizontal bars for each answer. Each bar displays behind the corresponding answer in the answer region.
Types of Slides 3D Pie Slide The 3D pie slide contains a three-dimensional pie chart with a slice for each answer and a key indicating the color representing each answer. 3D Pie Slide Distributed Pie Slide The distributed pie slide is similar to the 3D pie slide except the slices are separated from each other.
Types of Slides Offset Slide The offset slide contains a bar chart with horizontal bars for each answer. Each bar is shown directly below the corresponding answer in the answer region. Offset Slide Doughnut Slide The doughnut slide contains a pie chart with a hollow center with a slice for each answer and a key indicating the color representing each answer.
Types of Slides Responses Only Slide The responses only slide displays only the text results of responses. Depending on the settings, the results are display as a percentage or a vote count. No graph is displayed.
Types of Slides Competition Slides The second set of slides on the Insert Slide menu are the setup and summary slides for competitions. These slides assign teams and keep track of the participants or teams with the most points and fastest responses. Competition Slides Menu The competition slides include: Team Assignment Slide, Participant Leader Board, Team Leader Board, Team MVP, Fastest Responders, Racing Leader Board Slides, and Wager Slide.
Types of Slides Team Assignment Slide The Team Assignment slide allows audience members to choose a team. Simply include names for the teams in the answer list, and the participants will automatically be placed on the teams according to their answers. Display this slide early in the presentation so that participants can join a team at the beginning.
Types of Slides Participant Leader Board The Participant Leader Board displays the top individual participants ranked by their total points. This slide updates dynamically after each question. Participant Leader Board Use TurningPoint settings to specify the number of participants to show on the slide in the TurningPoint settings. Specify whether the point totals should be cumulative, or for the most recent question.
Types of Slides Team Leader Board The Team Leader Board displays the top teams ranked by their total points. (The team’s points are the average of the team’s participants’ points.) The slide updates dynamically after each question. Team Leader Board Use TurningPoint settings to specify the number of teams to show on the slide in the TurningPoint settings. Specify whether the point totals should be cumulative, or for the most recent question.
Types of Slides Team MVP The Team MVP slide displays the individual participant on each team with the most points. This feature requires a participant list, team, and correct answers. This slide is updated dynamically after each question. Team MVP Slide Fastest Responders The Fastest Responders slide displays the individual participants who responded correctly and the fastest to the most recent question. This feature requires a correct response or point value.
Types of Slides Racing Leader Board Slides The Racing Leader Board slides provide a graphical display of the Team Leader Board data in a three-part system. Stage 1 and Stage 2 are on the same slide (shown below). The teams will be displayed in an even line at Stage 1. Upon activating the animation (Stage 2), the objects will advance and display the winner of the current round. At the completion of team competition slides, the Winner Slide (show below) displays.
Types of Slides Racing Leader Board Slide - Horse Derby Race TurningPoint for Office 2007 User Guide 50
Types of Slides Wager Slide The Wager Slide allows participants to wager a percentage of their points on the next question slide. If the participant fails to correctly answer the slide, the amount of points wagered is lost. If the participant successfully answers the question, they are awarded that percentage of points.
Types of Slides Template Slides The third set of slides on the Insert Slide menu are templates for commonly used kinds of questions, such as Yes/No, True/False, Yes/No/Abstain, Likert Scale, Generic and Ice Breaker Slides. Template Slides Menu When any of the template slides are inserted, a chart of the default type (specified in the Settings) is placed onto the slide. The chart type can be changed on the inserted slide. Find information for changing chart types in Chart Slides on page 39.
Types of Slides Yes/No Slide A Yes/No slide is used for a question with a yes or no response. The slide includes a generically worded question and answers. The question text can be edited. Yes/No Slide True/False Slides A True/False slide is used for a question with a true or false response. The slide includes a generically worded question and answers. The question text can be edited.
Types of Slides Yes/No/Abstain Slide A Yes/No/Abstain slide is used with a yes or no response with an option to abstain. The slide includes a generically worded question and answers. The question text can be edited. Yes/No/Abstain Slide Likert Scale Slide A Likert Scale slide is used for a statement with a response of varying levels of agreement or disagreement. There are 4-, 5-, and 7-level Likert Scale slides. The slide includes a generically worded question and answers. The question text can be edited.
Types of Slides Generic Slide A Generic 2 to 10 answer slide allows you to insert a slide with up to 10 answers. The slide includes a generically worded question and answers. The question and answer text can be edited. Generic Slide Icebreaker Slides An Icebreaker slide is a slide with an analogy or word scramble question to get your audience involved in the TurningPoint presentation. Analogies are automatically generated, but a word must be supplied for the word scramble.
Types of Slides correct choice will be revealed after polling. Find more information on adding a Correct Answer Indicator in Add a Correct Answer Indicator on page 113. Analogy Slide The Word Scramble icebreaker slide requires the input of a word. Every other letter from the word is removed. The removed letters are scrambled and appear as one of four choices. The correct choice is automatically marked. If a Correct Answer Indicator is included, the correct choice will be revealed after polling.
Types of Slides Special Slides The final set of slides in the Insert Slides menu are special-purpose slides. They include: ResponseCard RF Channel Slide, ResponseWare Log-In, Fill in the Blank Slide, Essay Slide, Numeric Response Slide, Priority Ranking, Demographic Comparison, and Moment to Moment 1 to 5. Special Slides Menu ResponseCard RF Channel Slide The ResponseCard RF Channel Slide displays channel setting instructions for the ResponseCard Radio Frequency devices used by participants.
Types of Slides Once the channel is set correctly on the receiver, display the ResponseCard RF Channel Slide early in the presentation so that participants can update the channel on their devices. ResponseCard RF Channel Slide ResponseWare Log-In Slide The ResponseWare Log-In slide displays setup information for participants using ResponseWare to send their responses. The ResponseWare Log-In slide displays the ResponseWare session information.
Types of Slides successfully connect. Find more information on using ResponseWare in Chapter 4: Response Device and Settings Management. ResponseWare Log-In Slide Fill in the Blank Slide The Fill in the Blank slide contains a question region to pose a question. It does not contain an answer region or a chart, since the responses are in the form of text. ResponseCard XR and ResponseWare users may provide alphanumeric responses of varying lengths.
Types of Slides Specify one or more keywords in the TurningPoint settings that the answer should contain to be considered correct (for reporting and grading purposes). Find more information in Chapter 4: Response Device and Settings Management. Fill in the Blank Slide Numeric Response Slide The Numeric Response slide contains a question region to pose a question. It does not contain an answer region or a chart, since the responses are entered in manually through the response devices.
Types of Slides Essay Slide The Essay slide contains a question region to pose a question. It does not contain an answer region or a chart, since the responses are in the form of text. ResponseCard XR and ResponseWare users may provide alphanumeric responses of varying lengths. Essay Slide Priority Ranking Slide A Priority Ranking slide weighs participants’ choices and then ranks them accordingly. Priority Ranking slides allow participants to respond to a question or poll more than once.
Types of Slides The Priority Ranking slide displays the weighted scores assigned to the answers based on participant responses. Find more information in Insert a Priority Ranking Slide on page 68. Priority Ranking Slide Demographic Comparison Slide A Demographic Comparison slide shows results based on certain demographic information. The Demographic Comparison slide visually displays the results of a question based on certain demographic information obtained from the audience.
Types of Slides Demographic Comparison slide you must first designate a slide as “Demographic.” Find more information on Designate a Demographic Slide on page 74. Demographic Comparison Slide Tip For optimum readability it is recommend that the questions being compared contain no more than five answer choices each.
Types of Slides Comparative Links The Comparative Links slide can be used to display the results from two separate slides on one slide. For instance, ask a question in the beginning of the presentation and then again towards the end and use a comparative links slide to display the results from each time the question was asked.
Types of Slides Set the polling interval in seconds for a Moment to Moment Scoring slide in the TurningPoint settings using the Polling Cycle setting, a slide-level setting. Find more information about modifying settings in Chapter 4: Response Device and Settings Management.
Insert Special Slides Insert Special Slides Inserting some Special Slides differs from inserting Chart, Competition, Template, and other Special slides as outlined in Insert a Slide on page 37. These slides require additional information or changes to settings to function properly.
Insert Special Slides 3 Enter the Acceptable Value for the question. This value is considered the correct response for the question. 4 Enter a range of values instead of a specific value. • Check the box labeled Set Range. • Enter the Minimum value. • Enter the Maximum value. Note You may choose to enter both an Acceptable Value and Range. 5 Click OK. A new slide opens prompting you to enter question text. Numeric Response Slide 6 Enter the question.
Insert Special Slides Insert a Priority Ranking Slide Inserting a Priority Ranking slide to allows participants to respond multiple times to a question. The responses are then weighted and ranked accordingly. A Priority Ranking slide will determine what is most important to participants. Insert a Priority Ranking slide, select the number of responses to allow per participant, and then ask participants what is most important.
Insert Special Slides 2 Click Insert Slide on the TurningPoint Ribbon and select Priority Ranking. Priority Ranking Dialog Box 3 Enter the number of responses you wish to allow per participant. The default number of responses is set at 3. The maximum number of responses is 10. Find more information about changing the default number of responses in Chapter 4: Response Device and Settings Management. 4 Click OK. A new slide opens prompting you to enter question and answer text.
Insert Special Slides Poll participants and ask them to respond the selected number of times. Their responses are weighted and ranked: first responses are weighted more than second, second more than third, etc. Insert a Demographic Comparison Slide The Demographic Comparison slide can be used to visually display the results of a question slide in terms of certain demographic information gathered from the audience.
Insert Special Slides The Demographic Comparison slide is inserted displaying the demographic results in a chart. This slide creates its title based on the question slide. Demographic Comparison Slide Insert a Comparative Links Slide The Comparative Links slide can be used to display the results from two separate slides on one slide. Before You Begin Before setting up a comparative link, first create the slides you would like to compare.
Insert Special Slides The comparative links window opens. Comparative Links Window 2 Select a slide from the First Slide drop-down menu. 3 Select a slide to compare with in the Second Slide drop-down menu. 4 Click OK. • The Comparative Links Slide is inserted into the presentation. 5 Repeat steps 1through 4to add additional comparative links slides. Next Steps The chart will reflect the results from the first and second slide after response data has been collected.
Modify Slides Modify Slides TurningPoint slides are simply ordinary PowerPoint slides with extra features, customize them as you would an ordinary PowerPoint slide. Reorder slides, move objects, add text and pictures, apply fonts and color schemes, and use animations. Modify the features TurningPoint adds to your slides by changing chart types and colors, using pictures for answers, and adding Correct Answer Indicators.
Modify Slides Designate a Demographic Slide You can designate a slide as demographic to see how a certain group in your audience responds to certain questions. Slides designated as Demographic can be used in conjunction with Demographic Comparison Slides or Demographic Reports. To designate a slide as “Demographic”... 1 Click Tools on the TurningPoint Ribbon and select Settings. The Settings window opens. Settings Window 2 Select the slide to be designated as Demographic from the Settings Hierarchy.
Modify Slides A drop-down menu opens. Settings for Demographic Slide 4 Select True. 5 Click Done. The slide is now a Demographic slide.
Modify Slides • Alternatively, click the Demographic button in the Settings Pane. Settings Pane - Demographic Button Change Chart Types Can change the type on a TurningPoint slide using the Insert Object menu. To change a chart’s type… 1 Navigate to the TurningPoint slide to change the chart.
Modify Slides 2 Click Insert Object on the TurningPoint Ribbon and mouse over Charts or Animated 2D/3D Charts. Insert Object: Charts Insert Object: Animated 2D/3D Charts 3 Select the chart type. When the chart type is selected, TurningPoint changes the chart on the slide to match. A Responses Only chart type will remove any TurningPoint chart on the slide and only show the response percentages or response counts when polling.
Modify Slides Enable Zero-based Polling By default, answers are numbered 1-10, but the settings can be changed to enable answers to be numbered 0-9 for zero-based polling. To enable Zero-Based Polling... 1 Click Tools on the TurningPoint Ribbon and select Settings. 2 Select a Slide from the Settings Hierarchy. Selecting a slide affects the currently selected slide. Note The All Settings radio button must be selected to reveal the Zero-Based Polling Option for the presentation.
Modify Slides 2 Select the slide that contains the answer to be identified as correct from Settings Hierarchy. 3 Select the Answer to identify as correct. 4 Select Correct from the Answer Value drop-down menu. TurningPoint sets the selected answer as Correct and automatically sets all other answers on that slide as Incorrect. Note The Answer Value can be set to Correct or Incorrect from the slide. Find more information in Identify a Correct Answer on a TurningPoint Slide on page 79.
Modify Slides An Answer Values Task Pane opens and displays a list of the answers and their current answer values. Settings Pane - Answer Values 3 Select Correct from the Answer Value drop-down menu.
Modify Slides TurningPoint sets the selected answer as Correct and automatically sets all other answers as Incorrect. Answer Values Task Pane: Select Correct Note The Correct or Incorrect value can also be set in the Answer Value setting, an answer-level setting for each answer. Find more information in Identify a Correct Answer from the Settings Window on page 78. More than one correct answer can be assigned on a slide by repeating these steps on another answer.
Modify Slides Use Keywords for Fill in the Blank Slides Fill in the Blank slides do not have enumerated answers. However, you can specify that responses to a Fill in the Blank slide be counted as correct if they contain a certain word or words—a “keyword.” To use keywords… 1 Click Tools on the TurningPoint Ribbon and select Settings. The Settings window opens. Settings Window 2 If it is not already selected, select the slide from the Settings Hierarchy to assign keywords.
Modify Slides 3 Under the Misc settings, select Keywords. Settings Window: Keywords Note The Keywords setting will only be displayed if a Fill in the Blank or Essay slide is selected. Although keywords can be assigned for Essay slides, keywords are only considered for Fill in the Blank slides for reporting and grading purposes. 4 Enter the word(s) to include as keywords in the space provided. Separate multiple keywords with semicolons.
Modify Slides To set a point value for an answer… 1 Click Tools on the TurningPoint Ribbon and select Settings. To assign the same point values to the whole presentation, go to step 2. To assign point values to a specific slide, go to step 3. 2 To assign the same point values to the whole presentation: a Select Presentation from the Settings Hierarchy. The available presentation settings display in the right pane of the window.
Modify Slides A text box appears to enter a point value for correct answers. The point value can range from negative 10,000 through 10,000. Settings Window: Correct Point Value c Enter the correct point value. d Press the Enter key. Note Select the Apply All button to set the point value for all existing slides in the presentation. To set incorrect point values, go to step e. If all the incorrect point values have been set, go to step 4. e Under the Misc settings, select Incorrect Point Value.
Modify Slides A text box opens to enter a point value for incorrect answers. Settings Window: Incorrect Point Value f Enter the incorrect point value. g Press the Enter key. Note Select the Apply All button to set the point value for all existing slides in the presentation. To set point values for a specific slide go to step 3. Otherwise go to step 4. 3 To assign individual point values to a specific slide: a Select the slide from the Settings Hierarchy.
Modify Slides A text box appears to enter a point value for correct answers. The point value can range from negative 10,000 through 10,000. Settings Window: Correct Point Value c Enter the correct point value. d Press the Enter key. The correct point value is set. To set incorrect point values, go to step e. If all the point values have been set, go to step 4. e Under the Misc settings, select Incorrect Point Value.
Modify Slides A text box opens to enter a point value for incorrect answers. The point value can range from negative 10,000 through 10,000. Settings Window: Incorrect Point Value f Enter the incorrect point value. g Press the Enter key. The incorrect point value is set. Repeat step 3for each slide to assign individual point values. When finished setting the point values, go to step 4. Change the point value by repeating these steps on the same slide and entering a new point value.
Modify Slides Use speed scoring to award points for answers proportionally to fastest responders on an individual basis or in team competitions. Find more information in Use Speed Scoring on page 95. Note If negative points have been assigned to a correct answer or positive points to an incorrect answer, use the Point Value reports. The Percentage Reports treat the correct answers with negative point values as incorrect answers and incorrect answer with positive point values as correct answers.
Modify Slides To enable the Settings Pane, Click Tools > Enable Settings Pane. Enabling the Settings Task Pane 3 Place the cursor in the answer value box that corresponds to the answer to assign a point value. 4 Enter a point value in the dialog box and press the Enter key. TurningPoint sets the point value for the selected answer. Note The point value can also be set in the Settings window. Find more information in Set Point Values from the Settings Window on page 83.
Modify Slides Clear Answer Values from the Settings Window Reset the answer values to their original state from the Settings window. Selecting this option affects only slides created after the steps below have been performed. Clearing answer values from any existing slides must be done from the TurningPoint slide. To clear the answer values for a presentation… 1 Click Tools on the TurningPoint Ribbon and select Settings. 2 Select Presentation from the Settings Hierarchy.
Modify Slides 4 Click Yes to clear answer values. TurningPoint resets all of the answer values to the default values. Note This only resets the answer values for all slides created in the future. Find more information on resetting answer values for all existing slides in Clear Answer Values on a TurningPoint Slide on page 92. Click No cancel restoring all of the settings back to the default state. 5 Click Done. Note Answer values can also be cleared on a TurningPoint slide.
Modify Slides The Settings Pane displays a list of the answers and their current answer values.
Modify Slides 3 Click the Clear Answer Values button. Settings Pane: Clear Answer Values TurningPoint clears all of the answer values on the slide and sets them to No Value. Note To clear an answer value, set No Value in the Answer Value setting, a slide-level setting for each answer. Find more information in Clear Answer Values from the Settings Window on page 91.
Modify Slides Use Speed Scoring Speed scoring awards points proportionally based on how quickly a participant responds. Any slide with correct or point value answers marked can be used for speed scoring. Speed scoring calculates points based on when polling opens and closes or the length of a countdown when a Countdown Indicator is used. Below is an example that assumes polling remained open for ten seconds or a Countdown Indicator set at ten seconds was used.
Modify Slides A drop-down menu opens. Settings Window: Speed Scoring 4 Select True from the menu to enable speed scoring. • Select False to disable speed scoring. 5 Click Done (settings are saved automatically). Create Picture Slides Instead of using textual answers in the answer region, use pictures. This is useful if you pose a question where a visual aid will help the audience choose. To create a picture slide… 1 Create a TurningPoint slide.
Modify Slides The text in the answer region will be replaced by pictures. Therefore, it is recommended to use descriptive words or phrases in the answer region because this text will be used for the chart labels (answer aliases) and answer text in settings and reports. Note Since pictures are being used as answers, the horizontal and offset charts will not align correctly with the answers. Use a vertical, 3D pie, distributed pie, or doughnut chart. Find more information in Types of Slides on page 39.
Modify Slides 5 Click Convert to Picture Slide on the TurningPoint Ribbon. Convert Picture Slide Button After clicking the Convert to Picture Slide button, the answer region is hidden and the pictures are enumerated with a label, and the chart answers are updated with the answers assigned to them. Picture Slide After converting the answers to pictures, resize and arrange the pictures to adjust them. Additionally, a correct answer or point values may be identified.
Modify Slides To change chart colors… 1 Click Tools on the TurningPoint Ribbon and select Settings. 2 Select the All Settings radio button. The Chart Color settings display in the right pane of the window. Settings Window: All Settings 3 Select Presentation or a Slide from the Settings Hierarchy to specify whether to make changes to chart colors on the presentation-level or slide-level.
Modify Slides A drop-down menu opens. Chart Colors Setting 5 Select a value for the Chart Colors setting. There are three options: • Color Scheme - uses the color scheme of the PowerPoint presentation. • User Defined - uses ten user-defined colors. • Correct Incorrect - uses two user-defined colors, one for correct answers and one for incorrect. (The default colors for correct and incorrect are green and red, respectively.
Modify Slides 6 Specify the colors in the Chart Settings for User Defined or Correct Incorrect charts colors by completing the following steps: Settings Window Chart Settings a Select one of the colors labeled 1–10 or Correct and Incorrect. A grid of 40 color swatches opens. Color Swatches b Select a color from the swatches. The grid closes, and TurningPoint assigns the color. To change all colors back to their defaults, click the Defaults button.
Modify Slides If changes are made on a presentation-level, any new slides created will reflect the new colors. If changes are made to the slide-level setting, the slide selected will reflect the new colors. Make a PowerPoint Slide Interactive by Inserting a Chart Make an ordinary PowerPoint slide interactive by adding a chart to a slide that already has a question and a list of answers, or by creating a PowerPoint slide with a title and a bulleted or numbered list.
Modify Slides 2 Click Insert Object on the TurningPoint Ribbon and select Charts or Animated 2D/3D Charts. Insert Object: Charts Insert Object: Animated 2D/3D Charts 3 Select a chart to add to the slide. When the chart has been selected, TurningPoint converts the title of the slide to the question, the bulleted or numbered list to the answers, and adds the chart to the slide.
Modify Slides a chart will not be placed on the slide, the response percentages and response counts will display when polling closes. Note The bulleted or numbered answer list is re-numbered according to the TurningPoint settings. Numbering schemes can be modified for answers in the Answer Bullet Format setting, a presentationlevel setting. Find more information about modifying settings in Chapter 4: Response Device and Settings Management.
Modify Slides A drop-down menu opens. Auto Scale Setting 4 Select False to disable Auto Scale. Charts will not Auto Scale after this setting has been changed. • Select True to enable Auto Scale.
Add Objects Add Objects TurningPoint offers several static and interactive objects to add to slides: Answer Now prompts, Countdowns, Response Counters, Correct Answer Indicators, Text Message prompts, and Statistics Indicators.
Add Objects Add an Answer Now Indicator An Answer Now Indicator gives the audience a visual cue that the slide is a TurningPoint slide to which they can respond. An Answer Now Indicator appears during a presentation when polling opens and disappears when polling is closed. Answer Now Indicators are available in 12 styles. Note An Answer Now Indicator can be made to appear automatically on each TurningPoint slide that is created using the Answer Now setting, a presentation-level setting.
Add Objects A submenu opens displaying the available Answer Now Indicators. Answer Now Submenu 3 Select an Answer Now Indicator. TurningPoint places the Answer Now Indicator on the slide. Note The default text of Answer Now Indicators can be changed when they are added to a page by using the Answer Now Text setting, a presentation-level setting. Find more information about modifying settings in Chapter 4: Response Device and Settings Management.
Add Objects Add a Countdown Indicator A Countdown Indicator gives the audience a visual cue that polling for a question is about to close as it counts down to zero. When the countdown expires, the Countdown Indicator disappears and polling is automatically closed. To add a Countdown… 1 Navigate to the TurningPoint slide on which to add a Countdown. 2 Click Insert Object on the TurningPoint Ribbon and select Countdown.
Add Objects Add a Countdown Sound to a Countdown Indicator A Countdown Sound is a TurningPoint setting that allows a sound file to be added to the slide. It begins to play when the Countdown Indicator is activated. The acceptable file extensions include: .aiff, .au, .mid, .midi., .mp3, .wav, and .wma. The slide must have a Countdown to use a Countdown Sound. To add a Countdown Sound… 1 Click Tools on the TurningPoint Ribbon and select Settings. 2 Select the Settings tab.
Add Objects 5 Navigate to the folder where the sound file is located Countdown Sound: Windows Dialog Box 6 Select the file name. 7 Click Open. TurningPoint lists the file path of the sound file in the right pane of the Settings window.
Add Objects 8 Click Done. Note If the presentation will be used on a different computer, ensure that the Countdown Sound (sound file) is on the presentation computer and that it has the same file path. Otherwise, the presentation computer will not be able to use the Countdown Sound. For example, if the file path for the Countdown Sound is C:\Documents and Settings\My Documents\Explosion.wav, it must be ensured that the Countdown Sound is located at the same file path on the presenting computer.
Add Objects TurningPoint places the Response Counter on the slide. Note Specify that a Response Counter should appear automatically on each TurningPoint slide that is created using the Response Counter setting, a presentation-level setting. Find more information about modifying settings in Chapter 4: Response Device and Settings Management. The Response Counter can be moved or resized to better fit the slide. The Response Counter can be deleted if it is no longer needed on the slide.
Add Objects A submenu opens displaying the list of available Correct Answer Indicators. Correct Answer Indicator Submenu 3 Select a Correct Answer Indicator. TurningPoint places the Correct Answer Indicator on the slide. The Correct Answer Indicator can be deleted if it is no longer needed on the slide. To replace an existing Correct Answer Indicator with a different type, repeat these steps. The current Correct Answer Indicator will be replaced with the new one selected.
Add Objects More than one text message can be added to a slide. For example, add a “Respond Now” message to send when polling opens and a “Time Is Up” message to send when polling closes. Tip Since Text Messages are objects on the slide, use PowerPoint’s animation features to time when they should be displayed. Find more information in PowerPoint’s online help. To add a Text Message… 1 Navigate to the TurningPoint slide on which to add a Text Message.
Add Objects Add Statistics Indicators Statistics Indicators reveal statistics about the responses after polling is closed. The statistics can show the mean (average), median, standard deviation, and variance of the responses. The value of the statistic is revealed when the chart is displayed. Statistics Indicators Since the statistics are based on the number of answers, they are most useful for questions with an ordered scale of answers, such as a Likert scale.
Add Objects A submenu opens displaying the available Statistic Indicators. Statistics Submenu 3 Select a Statistic Indicator. TurningPoint places the Statistic Indicator on the slide. The Statistic Indicator can be moved or resized to better fit the slide. The Statistic Indicator can be deleted from the slide if it is no longer needed on the slide. Multiple Statistic Indicators can be added to the same slide (up to all four types).
4 Response Device and Settings Management This chapter discusses the installation and management of the Response Devices available to the audience. Additionally, this chapter describes the set up of the ResponseCard Presenter device, and various settings available for customizing a presentation.
The audience responds to interactive presentations with a response device. The response devices can be licensed from Turning Technologies for use with TurningPoint. These response devices include: Response Device Description Turning Technologies’ ResponseCard IR—a compact response device that uses infrared technology to send audience responses. Turning Technologies’ ResponseCard XL—a compact response device that uses infrared technology to send audience responses.
Response Device Description Turning Technologies’ ResponseCard NXT—a compact response device that uses radio frequency technology to send audience responses. It also allows for self-paced testing, which lets students enter responses to many different questions on the card’s multi-line LCD, then transmit all the answers at once. The NXT can also send the test score back to the participant after the responses have been submitted.
Install Devices Install Devices Users interact with a TurningPoint presentation using response devices that communicate through a receiver or the internet. Response device receivers are connected directly to the computer that will be used to run the presentation. This section includes instructions to install the device receivers.
Install Devices To install the infrared response device receiver… 1 Connect the device receiver to the USB port of the presentation computer. Windows detects the receiver and installs the proper drivers. The device is now ready for use. Infrared Response Device Receiver 2 Place the receiver in an unobstructed area at the front of the room. The receiver operates on a “line of sight” and needs to be positioned so it can receive the signal from the response devices.
Install Devices Install Radio Frequency Response Device Receiver The ResponseCards RF, XR, NXT and PresenterCard communicate with TurningPoint using a radio frequency. The receiver accepts the signal produced by the individual ResponseCards and passes the response to TurningPoint. ResponseCard RF, ResponseCard XR, ResponseCard NXT and PresenterCard Before You Begin The receiver must be connected to the machine that will be used to run the presentation.
Install Devices 2 The device is ready to use. Next Steps Go to Response Device Management on page 125to manage the settings for the response devices. If an audience member’s device is not being accepted, check the device’s ability to communicate. Go to Check Device Communication on page 130to test your response devices. Obtain the ResponseWare Device Settings The ResponseWare response device acts as a browser-based virtual response device.
Response Device Management Response Device Management Each audience participant uses a device to respond to questions asked during the presentation. TurningPoint needs to know what type of response devices will be used before the presentation is ran. Access the Response Device settings to confirm TurningPoint is configured properly.
Response Device Management Windows detects the receiver. The device is now ready for use. Note More than one USB Receiver may be needed for larger audiences (over 80 people for infrared or over 1,000 people for radio frequency). If there is more than one RF USB Receiver plugged in each receiver must be set to their own channel to prevent interference. For example, if one receiver is set to channel 41 then the second receiver should be set to channel 51.
Response Device Management The main ResponseWare screen opens. ResponseWare 2 Enter your ResponseWare Username and Password. 3 If you are connecting through a proxy server, check the box to enter the proxy settings. a Click Settings. b Select Automatically detect proxy settings or Manually configure proxy settings to enter the Address and Port. c If required, enter the Authentication information. d Click Test to test the connection to the proxy server. e Click Done.
Response Device Management 6 Click Login. 7 The first time you enable ResponseWare on a computer you will see the Privacy Statement and the Terms of Use Agreement. Read the Privacy Statement and the Terms of use Agreement and click Accept if you agree. You are now connected to the ResponseWare server. ResponseWare: Session Connected 8 Click Close. Closing the window does not disconnect you from the ResponseWare server.
Response Device Management c Press Channel. 3 Click Tools on the TurningPoint Ribbon and select Settings. 4 Select Response Device from the panel on the left. 5 Under the PresenterCard section, select [None]. The PresenterCard Pairing Window opens. PresenterCard Pairing Window 6 Press a button on the PresenterCard other than the Channel button. The Detected Device ID appears in the window. 7 Click Pair.
Response Device Management Check Device Communication You should test the communication between a device and TurningPoint if an audience member’s response is not being accepted during a live presentation. The use of a Response Counter or Response Grid will help to alert you of a non-communicating device. Find more information in Add a Response Counter on page 112or View a Response Grid on page 224. Before You Begin Ensure the device receiver is properly installed and the device to be tested is available.
Response Device Management TurningPoint displays the Polling Test window. Use this window to verify that TurningPoint can receive responses from the devices. Settings Window: Polling Test 3 Click Start Test. Magnify the responses by placing a check mark in the Magnify Values box. Polling Test: Magnify Responses 4 Press a key on each response device to be used.
Response Device Management TurningPoint displays the Device ID, Channel, and the key entry from each response device in the order in which they were tested. Polling Test: Response Device Test 5 Click End Test. 6 Click Done. The device communication check is now complete. Identify the Number of Devices to be Used Access the Response Device settings whenever you need to change the number of expected devices.
Response Device Management The Settings window opens. Settings Window 2 Select Response Device from the Settings Hierarchy. The available response device settings display in the right pane of the window. Settings Window: Response Devices 3 Select Expected Devices under ResponseCard Misc. A text box opens.
Response Device Management 4 Enter the number of expected devices. Note You cannot exceed the number of licensed devices. For example, if you enter the number of expected devices as 60 in this region, but TurningPoint is licensed for 50 devices, only 50 devices can be used during the presentation. This does not apply to presenters with an unlimited license. They can use as many response devices as they choose. 5 Press the Enter key. 6 Click Done.
Settings Settings TurningPoint allows you to view and modify various settings from the Settings window. To access the Settings window, click Tools on the TurningPoint Ribbon and select Settings. Settings Window The Settings window contains two tabs: Settings and Polling Test. See Check Device Communication on page 130for more information on Polling Test.
Settings At the bottom of the Settings window is a region that displays a detailed description of a setting when you select it. You can use these descriptions or the following pages to learn about the settings. The bottom region offers additional options for some presentation-level settings. Settings Window: Bottom Region The Common Settings and All Settings Radio Buttons allow you to select your level of customizations. The Common Settings Button displays the most commonly modified settings.
Settings Response Device Settings Response Device contains settings for the response devices compatible with TurningPoint. The list below contains more detailed information for each setting. Response Device Settings ResponseCard Channels Allows you to view the Response Receiver settings. Setting Description Receiver Displays Receiver ID and Channels of the receivers connected to computer.
Settings ResponseCard Misc Allows you to view and change various ResponseCard settings. Setting Description Force Channel Change Determines whether to force the Receiver Channel to changed at the time of connection to the computer. The default is set at False and will force TurningPoint to accept the channel from the receiver. True will set the receiver to the first available slot in TurningPoint.
Settings PresenterWare Allows you to view the PresenterWare settings. Setting Description Enable PresenterWare This setting, when set to True, allows you to connect via PresenterWare. PresenterWare Port The port that PresenterWare clients connect through. Only ports 1025 65535 are allowed. Some ports may not be available because they are in use by other applications or restricted for security reasons.
Settings ResponseWare Enables you to view and change various ResponseWare Web settings. Setting Description Always Show Login Info This setting, when set to True, will display the Login Info box as soon as a Slide Show is started. Presentation Settings Presentation contains settings for the creation of slides, the way they are displayed, and other TurningPoint options.
Settings Answer Settings Enables you to view and change Answer settings. Setting Description Answer Bullet Format Determines type of answer bullets TurningPoint will display. The available settings include: Alpha Lowercase Parenth = a), Alpha Lowercase Period = a., Alpha Uppercase Period = A., Decimal Parenth = 1), Decimal Period = 1., Roman Lowercase Period = i., Roman Uppercase Period I. The default is set at Decimal Period. Backup Settings Enables you to view and change the backup settings.
Settings Chart Settings This enables you to view and change the chart settings. Setting Description Auto Scale Charts Determines whether the charts are scaled proportionate to the responses or displayed forcing a scale of 0 to 100% for percentages and 0 to the maximum responses for count. The default is set to True, which sets the scale of the chart proportionate to the responses. Chart Colors Determines what chart colors will be used during your presentation.
Settings Competition Settings Allows you to view and change the settings for competition slides. Setting Description Default Number of Teams Determines how many teams are displayed in the Team Assignment slides. The acceptable range is 2-10 teams. The default is set at 5. Include Non-Responders Determines whether non-responders will be included in team scoring. The default is set to False, which does not include non-responders.
Settings Misc Enables you to view and change various settings. Setting Description Add-In always loaded Determines if TurningPoint loads with PowerPoint. The default is set to False, which does not automatically load TurningPoint. Allow Duplicates Determines whether participants are allowed to submit the same response more than once on multiple response slides. The default is set to False, which does not allow the same response to be submitted more than once on multiple response slides.
Settings Setting Description Multiple Response Divisor Determines whether the divisor used to calculate the percentages on a multiple response question will be the total number of responses received or the total number of devices that participated. The default is set to Devices. Responses Determines the number of responses accepted from a response device without overwriting the previous response. The acceptable range is 1-10 responses. The default is set to 1.
Settings Setting Description Bubble Size Value Format Determines the displayed format for bubble sizes. The acceptable formats are 0, 0.0 and 0.00. The default value is set to 0. Bubble Size Visible Determines if bubble size values are visible. The default is set to True, which shows the bubble size value. Racing Leader Board Settings Enables you to view and change settings for Racing Leader Board slides. Setting Description Animation Speed Sets the speed at which the teams move across the slide.
Settings Setting Description Countdown Seconds Set the number of seconds a Countdown object will display. The acceptable range is 1-999. The default is set at 10 seconds. Response Counter Determines whether a Response Counter object is automatically added to new slides. The default is set at None, which does not automatically add a Response Counter. All Response Counter objects are available to choose from. Response Counter Format Determines the format for new Response Counter objects.
Settings Setting Description Grid Position Determines the placement of the Response/Non-Response Grid when displayed. The acceptable positions are: Bottom, Bottom Left, Bottom Right, Center, Left, Right, Top, Top Left, Top Right. The default position is the Bottom of the screen. Grid Rotation Interval Determines the number of seconds a Response/Non-Response Grid will pause between intervals. The acceptable range is 1 to 10 seconds. The default is set at 2.
Settings Slide Settings Slide settings affect specific slides. Slide Settings Chart Settings This enables you to view and change the chart settings. Setting Description Chart Colors Determines what chart colors will be used during your presentation. The available settings are Color Scheme, Correct/Incorrect, and User Defined. Color Scheme - uses the selected PowerPoint color scheme. Correct/Incorrect - uses user defined colors for slides that have answers selected as correct and incorrect.
Settings Setting Description Chart Labels Determines if Answer Aliases (Answer Bullet Format) or Bullet Points will be displayed in the chart labels and legends. The default is set to Aliases. Chart Value Format Determines whether TurningPoint displays the chart values as a whole number (number of people who answered a question) or percentage (percentage of people who answer each question). The valid formats are: 0, 0%, 0.0%, and 0.00%. The default is set at 0%.
Settings Setting Description Response Data Determines whether a slide contains response data. When set to True, the slide has polled data and will not be polled again. When set to False, the slide can be polled again. The default is set to True. Responses Determines the number of responses accepted from a response device without overwriting the previous response. The acceptable range is 1-10 responses. The default is set to 1.
Settings Answer Settings Answer-level settings affect specific answers. The answer settings apply to the answer selected from the Settings Hierarchy. Answer Settings Answer Settings This enables you to view and change the Answer settings. Setting Description Answer Alias Determines the Alias (Name) that is used for the chart labels and in some reports. The default is set to the answers entered during slide creation.
5 Track Participants and Teams Participant Lists identify the members of your audience who will use a response device to respond to questions during your presentation. The participant name and other required information is stored along with the Device ID, a unique identifier for a response device. The Device ID is printed on the device tag, which is located on the back of the device (unless you are using ResponseWare software). This chapter discusses creating and managing a Participant List.
Participant List Wizard Participant List Wizard Create a Participant List using the Participant List Wizard or Learning Management Systems by Web CT, Blackboard, Sakai, and Turning Technologies On-line Roster. You may create multiple Participant Lists to be used with the same interactive presentation. One Participant List contains information about one audience group. Creating multiple Participant Lists allows you to capture responses from multiple audiences.
Participant List Wizard 2 Select a template to be used for the new Participant List. Participant List Wizard Participant List template choices include: • Education—contains standard student information used for K–12 and higher education presentations, such as name and student ID. • Corporate—contains entries for the information most often used in corporate feedback meetings including name, company name, telephone numbers, etc.
Participant List Wizard TurningPoint displays the Participant List information entries (called fields). All entries that make up the template appear in the Selected Fields region on the right. Use this page to add, delete, or reorder the entries that make up the template. Participant List Fields 4 You may choose to customize the list of Selected Fields. • To remove an entry from the template, select it under the Selected Fields region and click the left arrow button (<).
Participant List Wizard TurningPoint displays the Groups entry box. Use this screen to add Groups to your Participant List. Groups provide categorization for greater reporting opportunities, such as demographic reports or team competitions. Participant List Group Entry 6 You may choose to enter in a group name and click Add. TurningPoint displays all groups in the Included Groups list. Repeat this step to add additional groups. To remove a group, select it and click Remove.
Participant List Wizard You have the option to revise your Participant List Settings. The settings you can change include the Participant List file name, number of fields, and number of groups. For file name select the old file name and enter a new one in the box provided. For Number of Fields or Number of Groups, select the link to be returned to the screen and make edits. 8 Click Finish to create the Participant List.
Participant List Wizard Comma Delimited Tab Delimited Other - If selecting other, enter the delimited character in the box provided. d Select the Text Qualifier if necessary. e Select the Starting Row. If the .txt or .csv file contains a header row, it may be necessary to start with the second row. f Select the Starting Column. Tip A preview of the selected file is displayed in the bottom half of the Delimited File Import window.
Participant List Wizard Create a Participant List from a Learning Management System TurningPoint has been integrated with the following Learning Management Systems. • Blackboard (7, 8, and 9) • WebCT (CE 6.0, Vista 3, 4, or 8) • Sakai • Turning Technologies On-line Roster For instructions on creating a Participant List from a LMS, please refer to the LMS User guide downloaded from the Turning Technologies website.
Manage Participant Lists Manage Participant Lists After you have imported a Participant List or created one with the Participant List Wizard, you can make changes to a Participant List or delete it altogether. This section describes how to: • Modify a Participant List • Verify Participants and Device IDs • Delete a Participant List • Print a Participant List Modify a Participant List Follow these steps to make changes to an existing Participant List. Before You Begin A Participant List has a .
Manage Participant Lists 2 Select the desired Participant List and click Open. TurningPoint displays the Participant List data in the Participant Information window. 3 Edit the data by selecting the entries and typing new information. 4 You may choose to add a new participant by right-clicking in the numbered column and selecting Add Participant.
Manage Participant Lists 6 You may choose to add a new column by right-clicking on an existing column and selecting Add Field/Group > Add Field. The column will be added to the right of the existing column. Participant List - Add Column a Alternatively, select a column in the Participant Information window. TurningPoint inserts the new field to the right of the selected column. b Click Edit on the menu bar, mouse over Add Field/Group and select Add Field. An Add Participant Information window opens.
Manage Participant Lists TurningPoint adds the newly created field to the Selected Fields list. Participant List - Add Field/Group e Repeat steps b - d to add additional fields. f Click Finish. TurningPoint adds the fields to your Participant List. 7 You may choose to add a group by right-clicking on an existing column and select Add Field/Group > Add Group. The Group will be added to the right of the existing column. TurningPoint automatically designates a group as a demographic.
Manage Participant Lists 8 You may choose to rename a Field/Group by right-clicking the Field/Group and selecting Rename Field/Group. Participant List - Rename Field/Group a Alternatively, select the field or group that you want to rename. b Click Edit on the menu bar and select Rename Field/Group. A text entry window opens. c Enter the new name of the Field/Group. d Click OK. TurningPoint renames the selected field or group.
Manage Participant Lists 9 You may choose to remove a Field/Group by right-clicking on the Field/Group and selecting Remove Field/Group. Participant List - Remove Field/Group a Alternatively, select the Field/Group that you want to remove. b Click Edit on the menu bar and select Remove Field/Group. TurningPoint deletes the selected field. 10 You may choose to Freeze a column by right-clicking on the column and selecting Freeze Column. a Alternatively, select the column that you want to Freeze.
Manage Participant Lists TurningPoint limits the editing abilities while this function is active. Participant List - Rearrange Columns b Select the column you would like to be moved. c Drag and drop the column in its new location. 12 Click File > Save.
Manage Participant Lists A confirmation message displays. a Click OK. Participant List - Save Confirmation 13 Click Done. The Participant Information window closes. Verify Participants and Device IDs This section describes how to view the Participant List Display. Before You Begin You will need a participant list that contains the participant names and Device IDs. For instructions on how to create a participant list see Create a Participant List Using Participant List Wizard on page 154.
Manage Participant Lists 1 Select a participant list from the Participant List drop-down menu. Participant List Drop-down 2 Click Participants on the TurningPoint Ribbon and select Participant List Display. Delete a Participant List This section describes how to remove a Participant List from TurningPoint. Before You Begin Deleting a Participant List sends the file to the computer’s Recycle Bin. Save a backup copy in another location if you would like to be able to access the file later.
Manage Participant Lists To delete a Participant List… 1 Click Participants on the TurningPoint Ribbon and select Delete a Participant List. Participants Menu TurningPoint displays a window listing all Participant Lists that have been created or imported. 2 Select the file name of the Participant List you wish to remove. Delete Participant List 3 Click Delete. A window display confirming that you want to delete the selected Participant List.
Manage Participant Lists 4 Click Yes to delete the Participant List. TurningPoint removes the file from the list. Tip To retrieve a Participant List after deleting it, open the computer’s Recycle Bin, find the file and select it. Either select to Restore Item or drag and drop the file from the Recycle Bin to a new location. If you choose to drag and drop the file to a new location, It will not be available to TurningPoint unless you import the file.
Set Up Team Competitions Set Up Team Competitions TurningPoint can enhance group interaction. Team competitions are a fun way to encourage this interaction. Set up team competitions through the Participant List Wizard. You can create a Participant List that enables you to assign participants to teams who will compete for the highest score during your presentation.
Set Up Team Competitions In the Participant List Wizard window, TurningPoint displays the Groups entry box. Use this page to add groups to your Participant List. 2 Enter a group name in the Create a new group field, and click Add. Repeat for all desired team names. TurningPoint displays all groups in the Included Groups list. These groups can represent any type of grouping you wish to assign participants to, such as teams, class level, or any other demographic information.
Set Up Team Competitions TurningPoint displays the Participant List summary screen. Participant List Summary Page 5 Click Finish to create the Participant List and save it to a file. Next Steps Find more information about slides for keeping track of participants’ and teams’ points in Competition Slides on page 44.
Real-Time Registration Tool Real-Time Registration Tool The Real-Time Registration Tool provides a fast, simple way to create a participant list for smaller audiences (ideally less than 50 participants). Registration only takes a few moments, thus eliminating the need for a permanent participant list. The steps below can be performed before each class to ensure each participant has the appropriate response device.
Real-Time Registration Tool To verify Participants and Device IDs... 1 Select a participant list from the Participant List drop-down menu. Participant List Drop-down 2 Click Participants on the TurningPoint Ribbon and select Real-Time Registration Tool.
Real-Time Registration Tool 3 Click Registration Closed. The button label changes to “Registration Open” and the participants can begin to register their devices. 4 Each participant will need to locate their name. 5 Each participant must press the number on their response device that corresponds with the number to the left of their name. The Device ID for the participant will now appear in the Device ID column.
6 Tools TurningPoint offers several tools that allow you to use powerful advanced features: • Create slides to rank items • Create and assign standards for evaluating participants • Create slides aligned to state standards using QuestionPoint • Use conditional branching to control the order of slides in your presentation based on responses • Create slides from imported files TurningPoint for Office 2007 User Guide 178
Ranking Wizard Ranking Wizard You can quickly and easily create slides that support decision-making, prioritization, or other kinds of ranking with TurningPoint’s Ranking Wizard. The Ranking Wizard automatically creates slides to compare items on one to three criteria, then summarizes the results in a chart. For example, suppose you wanted to prioritize several projects you are considering. You might compare them on the basis of cost, impact, and urgency.
Ranking Wizard Create Slides with the Ranking Wizard The Ranking Wizard is located in the Tools menu on the TurningPoint Ribbon. It guides you through creating a set of ranking slides. To create slides with the Ranking Wizard… 1 Navigate to the slide you would like the ranking slides to be inserted after. When you complete the Ranking Wizard, the ranking slides will be added to the presentation after the currently selected slide. 2 Click Tools on the TurningPoint Ribbon and select Ranking Wizard.
Ranking Wizard 4 When you have added all the items to rank click Next. The next set of options allows you to specify the criteria that is displayed in the Ranking Wizard. Ranking Wizard: Enter Criteria 5 Enter a name for the X criterion and, optionally, the Y criterion, in the boxes provided. You must enter at least one criterion (X) for the ranking. If you are comparing only a single criterion, leave the Y criterion blank.
Ranking Wizard • Select Standard X/XY/XYZ to rank the items on a numerical scale for the criteria. You will specify the numerical scale to use later in the Ranking wizard if you choose a standard comparison. • Select Paired Comparison to compare the items by pairs on the criteria. If you choose paired comparisons, you may allow a response of No Preference by checking the box for that option.
Ranking Wizard Using Auto-Advance automatically advances the slide after all participants have responded to a question. Ranking Wizard: Auto - Advance 10 Check the box if you would like to display the charts for the slides created by the Ranking Wizard. Commonly, you are not interested in seeing the results for individual slides in the ranking questions.
Ranking Wizard 11 If you are using a Z criterion, check the boxes if you would like to use the following options: Ranking Wizard: Z Criteria • Show Bubble Names shows the name of each item on the bubble that represents it in the ranking chart. The chart also includes a key that color-codes the bubbles with the items. • Show Bubble Sizes shows the numerical size of each item’s bubble on the ranking chart. 12 When you have specified all the options you would like to use click Next.
Ranking Wizard For example, if you would like to use a scale of 1–4, uncheck the box next to 5. 14 If you would like to add labels to the numbers, right-click on a number and select Edit Text. You might like to add labels to the lowest and highest numbers of the scale (such as “Worst” and “Best”). 15 When you are finished modifying the ranking scale click Next. 16 Review the information in the summary to ensure that it is correct.
Standards Standards TurningPoint’s standards tools allow you to use K-12 standards (per state or country, topic, subject and grade level) or to create your own lists of standards on which participants can be evaluated. For training, teaching, or testing, standards help you organize the material in your presentation into subject areas, competencies, or other standards which the participants should meet. You can then view participants’ results by standards using Turning Reports.
Standards The Standards window opens. Standards Window 2 Select the K-12 Standards Lists tab. A window opens and displays four drop-down menus: Select a state or country…, Select a topic…, Select a subject…, and Select a grade….
Standards 3 Select a state from the Select a state or country… drop-down menu. K-12 Standards: Select a State or Country 4 Select a topic from the Select a topic … drop-down menu.
Standards 5 Select a subject from the Select a subject… drop-down menu. K-12 Standards: Select a Subject 6 Select a grade-level from the Select a grade… drop-down menu. All of the standards for the selected state/country, topic, subject, and grade-level display in the left pane of the Standards window. K-12 Standards: Select a Grade 7 Select a standard from the list.
Standards 8 Select to assign a standard to the presentation or an individual slide using the Current Standards List drop-down menu. K-12 Standards: Select Presentation or Slide 9 Select the right arrow button (>) to assign the standard to a presentation or individual slide. The standard displays in the list of standards in the right of the Standards window. K-12 Standards: Assign Standards Remove a standard using the left arrow button (<).
Standards If you would like to start over, you can select the Clear All button to clear all standards from all slides in the presentation. 11 When you are finished assigning standards, click Done. Create a Custom Standards List TurningPoint allows you to create a list of standards to suit your specific needs. You can also remove categories and standards using the delete keys on your keyboard. To create a Custom Standards List… 1 Click Tools on the TurningPoint Ribbon and select Standards.
Standards The New button allows you to create a custom Standards List. Custom Standards Window 3 Click New. TurningPoint prompts you to enter a new name for the Standards List. Custom Standards: New Standards List 4 Enter a name in the box provided and click OK.
Standards TurningPoint creates the Standards List in your Standards folder, displays it in the Current Selection drop-down menu, and displays the new Standards List in the left-hand pane of the Standards window. Custom Standards: Parent Category The new Standards List has a top-level (Parent) category with the same name as the list. Categories arrange standards into a hierarchy. 5 To add a category or a standard, complete the following steps. a Click Add Category or Add Standard.
Standards TurningPoint adds the category or standard to the parent category you selected. Custom Standards: Category and Standards Added c Repeat steps a and b to add additional categories and/or standards. You can delete a category or standard from the list using the Remove button. You can change the title of a category or standard using the Edit Field button. Custom Standards: Remove/Edit 6 When you are finished creating the Standards List, click Done.
Standards The changes are saved to your Standards List file, and the Standards window closes. Next Steps To associate standards with slides, follow the instructions in the next section, Assign Custom Standards to Slides. Assign Custom Standards to Slides Assigning a Custom Standards List to slides allows you to use Turning Reports to assess participant performance on slides relating to the standards. Before You Begin You should create or obtain Standards Lists to be assigned to the slides.
Standards The Current Selection drop-down menu displays the selected Standards list. The drop-down menu allows you to choose from the Standards Lists in your Standards folder. The Load button allows you to import a Standards List to your Standards folder from elsewhere. The Delete button allows you to delete a Standards List from your Standards folder. The New button allows you to create a custom Standards List.
Standards b Select a Standards List from elsewhere using the Load button. 4 Select to assign a standard to the presentation or an individual slide using the Current Standards List drop-down menu. Custom Standards: Select Presentation or Slide 5 Select the right arrow button (>) to assign the standard to a presentation or individual slide. The standard is displayed in the list of standards in the right-hand pane of the Standards window.
Standards Assign multiple standards or use multiple Standards Lists. If you would like to start over, you can select the Clear All button to clear all standards from all slides in the presentation. 7 When you are finished assigning standards, click Done. Next Steps Several reports allow you to assess participants’ performance on the standards you assigned. Find more information in Reports on page 232.
QuestionPoint QuestionPoint QuestionPoint is a question bank of 30,000 assessment items aligned to state standards and sorted by grade and subject. This bank of questions enables teachers and administrators to easily generate assessments and create interactive presentations from those assessments. This section describes how to: • Create Slides from QuestionPoint Create Slides from QuestionPoint QuestionPoint has been integrated with the TurningTalk user community.
Conditional Branching Conditional Branching Conditional branching allows you to control the order of slides in your presentation based on the responses received from the audience. For example, at the beginning of your presentation you might ask the participants to vote whether you’ll cover topic A or topic B. Depending on the results of the vote, the presentation will skip ahead to the slides for topic A or topic B.
Conditional Branching The Conditional Branching window opens. Conditional Branching Window 2 Select the slide where the branch will begin in the Selected Slide drop-down menu. Conditional Branching Window: Select Slide 3 Click Add to add a condition.
Conditional Branching The Conditional Rules box displays the condition with a default name of New Rule. Conditional Branching Window: New Rule 4 Optionally, rename the condition by clicking Rename. A dialog opens for you to enter the new name of the rule. Click OK. TurningPoint changes the name. Conditional Branching Window: Rename Condition 5 Optionally, create multiple conditions for a slide by clicking AND Condition or OR Condition as Logical Operators.
Conditional Branching Click OR Condition to link a conditional branching item to the previous item to specify that either condition can be met. If “Condition” or “Condition” then go to “Slide Selection.” Note You can link more than two conditional branching items for one slide. 6 Define all conditions in the Conditional Branching Rule Description by selecting the appropriate link. a Condition - Choose from the number or percentage of responders that must choose the same response to satisfy the condition.
Conditional Branching • Greater Than or Equal To (>=) • Less Than or Equal To (<=) • Value - Determines the value or percentage to be compared to in the next step. For Number of Responders, enter a number of responses (from 0 to the total number of participants). If you choose percentage, enter a percentage of responses (from 1 to 100). • Selected Answer - Determines what answer must be selected to make the condition true.
Parser Documents Parser Documents The TurningPoint Parser can import certain types of documents: • a QTI document • an XML document • a Microsoft Word document (.doc) • an Excel spreadsheet (.xls) To be imported by the TurningPoint Parser, these documents must be formatted in the proper way. The following sections describe the proper formats for documents imported by the Parser.
Parser Documents 3 Click the Preview & Publish Tab and select Save QTI XML File. 4 Select QTI XML zip file. 5 Click Save As. 6 Name the file and click Save.
Parser Documents Attribute Description count The total number of slide elements in the presentation. id An optional attribute that contains a unique identifier for the group of slides. slide Each slide element contains the question and answer information for a single slide. Attribute Description id An optional attribute that contains a unique identifier for the slide.
Parser Documents Attribute Description alias An optional attribute that contains an alias for the question. filename An optional attribute that contains a filename for a picture that can be included with the question. imageposition An optional attribute that sets the question picture position. The following are acceptable values: • L = Left • R = Right • F = Full topic The topic element contains the question topic.
Parser Documents Attribute Description alias An optional attribute that contains an alias for the question. value An optional attribute that contains a value for the answer. Valid answer values are “Correct,” “Incorrect,” or a point value from negative 10,000 through 10,000. filename An optional attribute that contains a filename for a picture that can be used in place of the answer text on the slide. This attribute is used only if the slide type attribute is set to “P”.
Parser Documents Tag Location Description and Allowed Values Following a question. Defines what type of slide to create using a single-letter code.
Parser Documents Figure 3-1 displays a sample Excel spreadsheet that contains information to create four TurningPoint slides. Figure 3-1 Figure 3-1 displays four questions and their corresponding answers. Column A contains Question Text, columns B through K may contain Answer Text, and all columns that follow after column K are ignored by the TurningPoint Parser. The text does not have to be in any specific font.
Parser Documents Tag Cell # Description and Allowed Values A3 or directly below Question Text Defines what type of slide to create using a single-letter code.
Import Slides Import Slides A simple slide presentation can be created by importing a QTI document, an XML document, Microsoft Word document, or an Excel document using the TurningPoint Parser. Alternatively, you can import question and answer data from TestingPoint. Using this feature of TurningPoint provides a quick way to create slides, and it is beneficial if you already have question and answer data in another form that you would like to transform into TurningPoint slides.
Import Slides A dialog window opens. Dialog Window 3 Navigate to the file you would like to import (.xml, .doc, .docx, .xls, .xlsx, .zip) and select it. 4 Click Open to continue. A dialog opens asking whether you would like to add the slides to the end of the current presentation or create a new presentation. 5 Click Yes to add the slides to the current presentation, or click No to create a new presentation. TurningPoint builds the slides from the file.
Import Slides A dialog opens. Import a TestingPoint Document dialog 2 Navigate to the file you would like to import and select it. 3 Click Open to continue. A dialog opens asking whether you would like to add the slides to the end of the current presentation or create a new presentation. Import Dialog Box 4 Click Yes to add the slides to the current presentation, or click No to create a new presentation. TurningPoint builds the slides from the file. If there are many slides, this may take some time.
7 Run Presentations After you have created the slides and objects discussed in Chapter 3: Creating and Saving Slides, you are ready to run an interactive presentation. This chapter describes how to: • Run an interactive presentation using the Slide Show functionality. • Control the presentation using the Showbar. • Monitor the audience participation.
Run a Presentation Run a Presentation You run an interactive presentation session using PowerPoint’s Slide Show functionality. You control the presentation session by opening and closing polling. Polling is the mechanism by which TurningPoint accepts and tallies the responses provided by the audience using response devices.
Run a Presentation If you want to track responses, you also must have created a Participant List using the Participant List Wizard. Without a Participant List, the session collects anonymous responses and generates an automatic Participant List. Find information on Participant Lists in Chapter 5: Track Participants and Teams. To create the settings for the presentation session… 1 From the PowerPoint Office menu, select Open. A window opens and displays the available files.
Run a Presentation • Simulated Data—TurningPoint provides random responses to the presentation. TurningPoint determines the number of responses to provide based on the number of expected devices designated in settings. i.e. If you enter expected devices as 100, TurningPoint will provide 100 responses to each question in your presentation. If you have a participant list selected TurningPoint will provide responses for each participant in the list.
Run a Presentation If Auto is selected, response Device IDs and participants’ choices are collected without a Participant List. If Anonymous is selected, only participants’ choices are collected. The default setting is Auto. Note You can change the default Participant List setting to Auto or Anonymous using the Default Participant setting, a presentation-level setting. Find more information on modifying settings in Response Device and Settings Management on page 118.
Run a Presentation • Grid Opacity—enter a percentage to identify how opaque the Response Grid should be when opened. • Grid Position—choose a selection from the menu to identify where the Response Grid should be positioned on the screen. The selections include Top, Bottom, Left, Right, Center, TopLeft, TopRight, BottomLeft, and BottomRight. • Grid Rotation Interval—enter the number of seconds per interval the Response Grid takes to rotate through responses.
Run a Presentation Right-click on the Showbar and move your cursor across the Showbar to display each command’s name. To activate the command, you can select the Showbar icon or use the respective Fn key on your keyboard. Use the commands on the Showbar as follows: Shorten Showbar Shortens the showbar and only displays Responses and Polling Status. F9-Show/Hide Showbar Closes the Showbar for the duration of the current presentation session. F2-Toggle Results Changes the values displayed on each chart.
Run a Presentation Shift + F5-Insert Slide Select the down arrow to open a drop-down menu allowing you to select the slide type to be inserted into the presentation. Select the icon to open a window asking for a question and answer choices. Enable/Disable ResponseWare Allows the presenter to Enable/Disable ResponseWare connections. It also allows the presenter to show or hide the login info for ResponseWare Web. Press for moveable Showbar Allows the Showbar to be moved anywhere on the Screen.
Run a Presentation c Click again to advance to the next slide. Note To advance slides, you may use any method PowerPoint allows, such as clicking the mouse or pressing the space bar, arrow keys, or Enter key. 3 Click at the end of the slides to exit from the Slide Show (or optionally, press the Esc key). If you exit TurningPoint, the program prompts you to name and save the session results to a file. The default location is My Documents/TurningPoint/Sessions.
Run a Presentation The Response Grid is a grid that is overlaid on a slide during the presentation and indicates which individuals enter responses. Similarly, the Non-Response Grid indicates which participants have yet to respond. These grids give the participants confirmation that their responses were received. Response Grid The Response Grid can be shown or hidden at will by selecting the Show Response Grid button. When this button is selected, the Response Grid does not display.
Run a Presentation To monitor participants… 1 While running the slide show, click the Display Participant Monitor button on the Showbar. Display Participant Monitor Alternatively, you can display the Participant monitor after running a slide show by selecting Participants > Display Participant Monitor from the TurningPoint Ribbon.
Run a Presentation When viewing the Participant Monitor while running the slide show, the Participant Monitor window must be closed to advance to the next slide. To view the window again, press the F12 key. (Alternatively, you can press the Alt + Tab keys, or simply end the slide show.) Participant Monitor Window: View Menu 3 Optionally, you can expand or reduce the size of the three regions by selecting the borders and dragging them up or down.
Run a Presentation A drop-down menu opens from the Showbar allowing you to select the slide type to be inserted into the presentation. Insert a Template Slide The slide is automatically inserted. • Custom Slide - select the Insert Slide on the Fly icon on the showbar. Insert a Custom Slide The Custom Question window opens to display the fields for typing the question and answer choices to be used on the interactive slide.
Run a Presentation 2 Enter the question in the top region of the window. Enter the answer choices in the lower region, separating each answer with a line break. Insert Slide: Custom Question Note If you would like to reuse the presentation with the newly added slide, save the file. From the PowerPoint menu, select File > Save As. If you forget, TurningPoint asks you before closing. 3 Click Insert.
Run a Presentation Before You Begin To measure demographic information, insert a question slide early in the presentation that asks the audience to identify themselves in a demographic category, such as an age group or gender. Note To use demographic information in reports, identify a slide as a demographic question in the TurningPoint settings at the slide-level. Set the Demographic setting to True. Find more information in Response Device and Settings Management on page 118and Reports on page 232.
Run a Presentation For the example, to find out how many young adults prefer each type of music, you would select the 18–35 age range. Data Slicing 5 Click Select. TurningPoint retabulates the data to show the new distribution. Instead of viewing the results for the entire audience, you see the distribution for only the participants in the audience who submitted the selected answer.
8 Reports Reports allows you to generate and view a wide variety of reports based on the responses you received during your TurningPoint, TurningPoint Anywhere, or TestingPoint sessions. The reports are generated as printable Word documents or Excel worksheets with information about the questions and answers, participants, and responses gathered in your presentation. Turning Reports displays a hierarchical menu of reports organized by category, such as Results by Question Reports and Demographic Reports.
View a Report View a Report You can create reports using Turning Reports available in the Tools menu in the TurningPoint Ribbon. This section describes how to: • View a Report View a Report Use Turning Reports to generate reports. Before You Begin Create a session file by running a presentation session. Find more information in Chapter 7: Run Presentations. To view a report… 1 Click Tools on the TurningPoint Ribbon and select Reports.
View a Report The Turning Reports window displays a list of the session files in your Sessions folder. You can toggle which files are displayed in the list by selecting My Session Files or My Backup Session Files. Find more information about where your session files are stored in Save Results from a Session on page 251. 3 Choose a session file. You may choose a session file in one of the following ways: • Select the Current Session (in red text) to use the session currently open in PowerPoint.
View a Report Each category of reports is listed by name. You can double-click the category or click on the plus sign beside the category to view a list of reports in each category. The icon beside the report name indicates whether it generates an Excel file or a Word file. When you select a report, you can see a sample preview of the report on the right-hand side of the Turning Reports window. 5 Select the type of report(s) you would like to generate by selecting the check box next to the report name.
View a Report Depending on the type of report you select, the Include Page Breaks check box may be displayed below the report preview. Include Page Breaks 6 Specify whether to include page breaks in the report by checking the Include Page Breaks check box (if available). If you check the box, TurningPointwill create page breaks at convenient places in the report for ease of printing. 7 Click Generate Report.
View a Report You can generate as many reports as you like. When one report is finished being created, select another type of report from the list and select the Generate Report button again. Note Alternatively, you can generate a report by double clicking on the report name. Only that report will be generated. Any other reports that were selected will have to be generated by double clicking each report or selecting the Generate Report button to generate them all.
Types of Reports Types of Reports This section describes: • Results by Question Reports (2 Reports) • Demographic Reports (2 Reports) • Participant Results Reports (4 Reports) • Results by Participant Reports (4 Reports) • Participant List Reports (2 Reports) • Standards Reports (3 Reports) • Comparative Scoring Reports (2 Reports) • Team Scoring Reports (2 Reports) • Percentile Reports (2 Reports) • Other Reports(9 Reports) • Attendance Report • Comparative Links Report • Discrimination/Difficulty Indexe
Types of Reports Results by Question Reports The Graphical Results by Question and Results by Question Reports show a summary of responses for each question. Each of these reports creates an Excel worksheet.
Types of Reports Demographic Reports The Demographic Comparison and Graphical Demographic Comparison Reports show a summary of responses for each question broken down by demographics. Each of these reports creates an Excel worksheet.
Types of Reports Participant Results Reports The Participant Results, Graded Participant Results (correct/incorrect), Graded Participant Results (point values), and Graded Participant Results (ratio) Reports show a detailed question by question breakdown of responses. When generating these reports you have the option of displaying the entire question or excluding the question text. There is also an option to display response times for the participants. Each of these reports creates an Excel worksheet.
Types of Reports Graded Participant Results (ratio) Report The report includes the following information for each participant: • Device ID • fields defined in the Participant List • the numerical value of the participant’s response to each question • an indication of whether the response is correct or incorrect • the ratio of correct answers to total number of answers for each question Results by Participant Reports The Results by Participant, Results by Participant (Answer Detail), Response by Participa
Types of Reports Results by Participant (Response Detail) Report The Response Detail Report includes the question along with the participant’s response. The report displays correct answers in green, incorrect answers in red, the correct answer in brackets for incorrect answers, and calculates the percentage of correct answers and the total points accumulated by each participant.
Types of Reports Standards Reports The Group Standards, Individual, and Overall Standards Reports show response information based on standards identified for each question. Each of these reports creates an Excel worksheet. Group Standards Report The Group Standards Report displays the percentage of correct responses from each group for each standard.
Types of Reports Comparative Scoring Reports The Individual Scoring and Scoring Distribution Reports show a summary of scoring information based on participant responses in comparison to other participants. Each of these reports creates an Excel worksheet.
Types of Reports Team Scoring Reports The Team Scoring (Percentage) and the Team Scoring (Points) Reports show overall team results, the correct answer for each questions, the number of responses per answer for each question, the results for each question, and the correct answer highlighted in green. While generating these reports, you have the option to exclude response details. Each of these reports creates an Excel worksheet.
Types of Reports Percentile (points) Report The Percentile (points) Report includes the following additional information: • the total points accumulated by each participant Other Reports The Other Reports option TurningPoint offers nine uncategorized reports: Attendance, Comparative Links, Participants Questions/Comments, Moment to Moment, Outline, Response Data Export, Ranking Summary, and Statistics Reports. Each of these reports with the exception of the Outline Report creates an Excel worksheet.
Types of Reports • D = (NH + NL) / T Formula for the Discrimination Index: • D = Discrimination Index • NH = Number of correct responses in the top 27%* (participants who responded with the most number of correct answers during the session) • NL = Number of correct responses in lower 27%* (participants who responded with the least number of correct answers during the session) • T = Number of total responses in the top and lower groups • D = (NH - NL) / .
Types of Reports Ranking Summary Report The Ranking Summary Report shows a summary of Ranking Slides. The Ranking Report includes the following information: • a list of the ranking criteria • a list of the ranked items and the rank assigned for each criterion • the chart showing the ranking Results by Group Report The Results by Group Report shows a summary of correct responses for each question by group.
9 Sessions TurningPoint creates session files whenever you run a TurningPoint presentation, and they are stored temporarily. You can, however, save the session in a file for later access. When you save a session, a default TurningPoint setting automatically includes the PowerPoint presentation with your TurningPoint file. You have the option to exclude the PowerPoint presentation from the TurningPoint session file.
Manage and Edit Sessions Manage and Edit Sessions With TurningPoint, you can stop and save a session, and pick up where you left off at a later time. You can also use a TurningPoint setting to create back-up files of your session. Knowing how to save and resume a session gives you greater flexibility during your presentation.
Manage and Edit Sessions TurningPoint displays the Save Session dialog that shows the file name, file type, and where the file will be saved. The default location is My Documents\TurningPoint\Sessions. If you choose the default name, TurningPoint adds the date and time to the file name. If you choose to rename it, the name you chose is stored. Save Session Dialog If you wish to change the default location, select a file folder to save the session and give the session a file name.
Manage and Edit Sessions Change the Default Save Location Changing the default save location for your TurningPoint folder changes the save location of your session files, Participant Lists, and standards. Before You Begin Identify a reliable location on the computer where you want to save your TurningPoint documents. To change the default save location… 1 Click Tools on the TurningPoint Ribbon and select Settings. The Settings window opens.
Manage and Edit Sessions Find the Misc settings. Settings Window: Misc Settings 5 Under the Misc settings, find Default Save Location and click on the file path. A Default TurningPoint Save Path window opens. Default Save Location Window You can manually enter the location or click on the box to the right of the file path (box with ellipses) to display a dialog box. From the dialog box, you can browse to an existing folder location or create a new folder location. 6 Select a new default location.
Manage and Edit Sessions Continue a Previously Saved Session TurningPoint can resume your presentation using a saved session file. TurningPoint appends new session information to the opened session file, allowing you to save the polling results for the presentation in one file. Before You Begin If the session file is saved on an external storage device, insert the device into the computer. Locate the session you wish to open.
Manage and Edit Sessions Edit Session Data You can edit TurningPoint, TurningPoint Anywhere, or TestingPoint session data after the session is saved. You can choose to exclude a question, make a question demographic, or change answer values. To edit session data… 1 Click Tools on the TurningPoint Ribbon and mouse over Session Management. The Tools menu opens. Select Session Management: Edit Session 2 Select Edit Session.
Manage and Edit Sessions The Edit Session window opens, displaying a list of session files in your sessions folder. Edit Session Window You can toggle which files are displayed in the list by selecting My Session Files or My Backup Session Files. Find more information about where your session files are stored in Save Results from a Session on page 251. 3 Choose a session file.
Manage and Edit Sessions The Edit Session window displays options for editing the session file. Edit Session Window: Edit Session The window shows a list of all questions in the session. Below the list of questions is a list of answers, which shows the answers for the questions selected in the list above. 5 Uncheck the box next to any question in the list that you would like to exclude from the session. Excluding a question will omit all data about that question from the session file.
Manage and Edit Sessions 7 If you would like to change an answer value, right-click on the answer in the answer list and select an option from the Contextual menu that opens. You can mark the answer Correct or Incorrect, assign a point value, or clear the answer value (set to No Value). Edit Session Window: Change Answer Value 8 When you are finished making changes to the session data, click Save Session below the list of answers.
Manage and Edit Sessions Delete Results from a Session You can use the same presentation to create a new set of responses. The Reset menu on the TurningPoint Ribbon gives you the option of deleting the results from slides in order to redo a session or present a new session. The slide results will still be stored in the session data, but the slide will be cleared so it can be used in a new presentation. You also have the option to redo only one question slide in a session.
10 Export When you complete a session, you save the data in a TurningPointsession file (extension.tpz). Find more information on how to save a session in Save Results from a Session on page 251. The session file contains all the information about your presentation, including the questions and answers, the response data, and the Participant List. This information is used to generate reports (find more information in Reports on page 232).
Export Session Data This section describes how to: • Export Session Data • Export Session Data as a CSV File • Export Results Data to a Learning Management System (LMS) • Merge Participant List • Merge Session Files • Extract Participant List • Extract PowerPoint Presentation • Extract Session Data as XML • E-mail Session Export Session Data You can export data from a TurningPoint, TurningPoint Anywhere, or TestingPoint session file into a text file.
Export Session Data The Export Session window opens, displaying a list of session files in your Session Folder. Export Session Data Window You can toggle which files are displayed in the list by selecting My Session Files or My Backup Session Files. Find more information about where your session files are stored in Save Results from a Session on page 251. 3 Choose a session file.
Export Session Data The Export Session window displays lists of the data and formats you can use to export the session file. Export Session Data: Select Export Scheme or Data Groups 5 Choose one of these two ways to export the data: • Check some or all of the boxes in the Data Group list to manually specify the contents and format of the exported text file. The following data is available for export: • • • • The text of questions and answers.
Export Session Data The Export Sessions window displays a tabbed view for you to specify the data to be used. Export Session Data: Include or Exclude Data There are five tabs, one for each of the main groups of data you specified to include in the exported file. In each area you chose to include, review and modify the settings on the corresponding tab. The next few steps explain the settings on each tab.
Export Session Data Show Responses Horizontally will group the response data by question in the exported file. Show Responses Vertically will group the response data by participant in the exported file. 12 Select the Scores tab. The Export Data window displays the Scores tab. Include or Exclude Data: Scores Tab 13 If you chose to include the scores, specify the following settings: • Select whether to calculate scores based on Correct/Incorrect values or based on point values.
Export Session Data Questions you designate as bonus questions are not included in the total number of questions for calculating scores, but are included in a participant’s number of correct responses. 14 When you have finished modifying the settings on the applicable tabs, click Next. The Export Data window displays a group of settings for specifying the format of the exported file.
Export Session Data The format you choose depends on how you will use the exported file. 17 Specify whether to use double quotes, single quotes, or no quotes to enclose the text in fields. Note You should use either double or single quotes for the text qualifier if you are exporting a fixed-width file or using spaces as delimiters in a delimited file. Without quotes, the field boundaries in the exported file will be impossible to interpret correctly.
Export Session Data as a CSV File Optionally, you can click the Save Export Scheme button (shaped like a disk) to create an export scheme you can reuse to save the data from other session files in the same format. Specify a location and filename for the export scheme in the same way. 22 Click Finish to exit the Export Data window.
Export Results Data to a Learning Management System (LMS) Export Results Data to a Learning Management System (LMS) TurningPoint has been integrated with the following Learning Management Systems. • Blackboard (7, 8, and 9) • WebCT (CE 6.0, Vista 3, 4, or 8) • Sakai • Moodle • Performance Matters For instructions on exporting to a LMS, please refer to the LMS User guide downloaded from the Turning Technologies website.
Merge Participant List Highlight the sessions and use the left (<) button to add the sessions to your column. Use the right (>) to remove sessions from your column. When selecting session files, hold Shift to select multiple contiguous sessions, or Control to select multiple sessions. Note Alternatively, double-click a session to add it to your column. • Select the Current Session (in red text) to use the session currently open in PowerPoint.
Merge Session Files Merge Session Files You can merge multiple TurningPoint, TurningPoint Anywhere, or TestingPoint session files together to create a single session file, from which you can generate reports and extract data. This is especially useful if you have session files from multiple presentations given to the same participants. You can aggregate the data from all the presentations into a single file with all the responses from each participant.
Merge Session Files • Import a session file from another location. You can also import a session using the Import Session button (shaped like a folder) above the list of files. This allows you to use a TurningPoint, TurningPoint Anywhere, or TestingPoint session file you have saved elsewhere. Unless you originally created the session in TurningPoint, TurningPoint Anywhere, or TestingPoint, the session files will not hold a PowerPoint presentation file.
Extract Participant List Extract Participant List You can extract the Participant List from a TurningPoint, TurningPoint Anywhere, or TestingPoint session file. This is especially useful if you have a session file but have lost the Participant List file or if you set up the list on a different computer. To extract a Participant List… 1 Click Tools on the TurningPoint Ribbon and mouse over Session Management. 2 Select Extract Participant List.
Extract PowerPoint Presentation 5 Specify a name and location for the exported file. Note Ensure that the .tpl file extension is used for Participant List files. 6 Click Save. The file is saved, and the dialog closes. 7 Click Finish to exit the Extract Participant List window. Next Steps You can now edit the Participant List or use it in a presentation. Find more information in Chapter 5: Track Participants and Teams.
Extract Session Data as XML This option is available only if you have a TurningPointpresentation open and response data has been collected. • Select a session file from the list of files in your Sessions folder. To display the session files from your Sessions folder in the list of files, select My Session Files. • Select a session file from your backup session files. To display the backup session files in the list of files, select My Backup Session Files. • Import a session file from another location.
Extract Session Data as XML 2 Select Extract Session XML File. The Extract Session XML File window opens, displaying a list of session files in your Sessions folder. You can also import a session using the Import Session button (shaped like a folder) above the list of files. This allows you to use a TurningPoint, TurningPoint Anywhere, or TestingPoint session file you have copied from elsewhere. 3 Choose a session file.
E-mail Session E-mail Session You can use Session Management to quickly and easily send one or more TurningPoint, TurningPoint Anywhere, or TestingPoint session files by e-mail. Before You Begin To use this feature, you must have access to the internet on the computer that has TurningPoint installed. To e-mail a session file using an SMTP client… 1 Click Tools on the TurningPoint Ribbon and mouse over Session Management. 2 Select Send Sessions.
E-mail Session TurningPoint attaches the session(s) to the e-mail and displays the session name in the lower portion of the Send Sessions window. 10 Set the SMTP Server. a Select Tools > Change SMTP Server. An SMTP Server window opens. b Enter the SMTP server. You may need to check with your IT Department for this information. c Select OK. Your SMTP server has been set. If you need to change the SMTP Sever, repeat this step. 11 Click Send.
A Frequently Asked Questions This appendix offers you a quick reference to common questions that customers have about using the TurningPoint software. If you do not find an answer to your question here, visit the Turning Technologies web site at http://www.turningtechnologies.com or call a Turning Representative toll-free at 1-866-7463015. Why can’t I install TurningPoint? You must be the local administrator to install TurningPoint for the first time using the administrative username and password.
ResponseCard XL, ResponseCard RF, ResponseCard XR, and ResponseCard NXT are products that are optimally suited for use with TurningPoint. Users also have the option of using TurningPoint’s ResponseWare for a virtual keypad. How do I set up the response devices? All of the response device settings can be found in the Settings windows. From the TurningPoint Ribbon, select the Tools > Settings. Find information about Installing Response Devices in Chapter 4: Response Device and Settings Management.
How do I clear data from a session or a slide? From the TurningPoint Ribbon, select the Reset menu, and then select Session or Current Slide from menu. Find information about working with sessions in Chapter 9: Sessions. How do I save a session? From the TurningPoint Ribbon, select the Save Session button, which looks like a disk. A window opens allowing you to select a file name and location. Save the file in the Sessions folder, located at My Documents\TurningPoint\Sessions.