
User manual


def HorizBar(row,startCol,length):
GotoXY(row,startCol) #go to starting position
for count in range(length):
SendByte(0xFF,True) #display bar of desired length
This simple code works, and is surprisingly useful. You aren’t limited to small ranges: just
scale the desired range to 0-15 by the appropriate conversion factor. But your graph will
always look a little coarse and chunky, since there are a limited number of possible data
values/lengths.
3) BETTER HORIZONTAL BAR GRAPHS
The graph will look better if we improve the horizontal resolution. But how? We can get a
five-fold improvement in resolution if we use the simple graphics from Part 3.
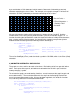
Consider the individual character. It contains 40 individual pixel “dots”,
arranged in an 8 row, 5 column grid. We can’t access each individual
pixel, but we can create custom symbols like this vertical bar. Display this
one to the right of the 12-character bar above, and you’ve just made a bar
of length 12.2!
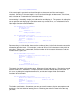
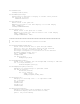
Let’s make a set of vertical bar symbols, progressively increasing the
number of columns in the symbol
0.2 0.4 0.6 0.8 1.0
Now we can increment the length of our horizontal bar in fractions of a character, improving
the horizontal resolution of our graph. It’s time to code it. First, create the set of symbols,
like we did in part 3:
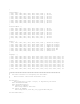
horizontalBars = [
[ 0x10, 0x10, 0x10, 0x10, 0x10, 0x10, 0x10, 0x10 ], #1 bar
[ 0x18, 0x18, 0x18, 0x18, 0x18, 0x18, 0x18, 0x18 ], #2 bars
[ 0x1C, 0x1C, 0x1C, 0x1C, 0x1C, 0x1C, 0x1C, 0x1C ], #3 bars
[ 0x1E, 0x1E, 0x1E, 0x1E, 0x1E, 0x1E, 0x1E, 0x1E ], #4 bars
[ 0x1F, 0x1F, 0x1F, 0x1F, 0x1F, 0x1F, 0x1F, 0x1F ] #5 bars
]
Now we need a routine to draw the horizontal bar for a given length. To simplify things, let’s
stay with integer lengths, and give each vertical bar a length of one (instead of 0.2). In this
system our original 12 character bar is 12*5 = 60 units long. Any length can be represented
1
0
0
0
0
1
0
0
0
0
1
0
0
0
0
1
0
0
0
0
1
0
0
0
0
1
0
0
0
0
1
0
0
0
0
1
0
0
0
0