
Data Sheet

HIH-4030/31 Series
4 www.honeywell.com/sensing
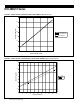
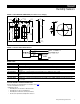
FIGURE 3. TYPICAL OUTPUT VOLTAGE VS RELATIVE HUMIDITY (At 25 ºC and 5 V.)
0.5
1
1.5
2
2.5
3
3.5
4
0 20406080100
Relative Humidity (%RH)
Output Voltage (Vdc)
Sensor Response
Sensor Response
Best Linear Fit
FIGURE 4. TYPICAL OUTPUT VOLTAGE (BFSL) VS RELATIVE HUMIDITY (At 0 ºC, 70 ºC and 5 V.)
0
0.5
1
1.5
2
2.5
3
3.5
4
4.5
0 102030405060708090100
Relative Humidity (%)
Output Voltage (Vdc)
0 C
70 C