USER'S GUIDE Vaisala Observation Display for AWS330 M211326EN-A
PUBLISHED BY Vaisala Oyj P.O. Box 26 FI-00421 Helsinki Finland Phone (int.): +358 9 8949 1 Fax: +358 9 8949 2227 Visit our Internet pages at www.vaisala.com. © Vaisala 2011 No part of this manual may be reproduced in any form or by any means, electronic or mechanical (including photocopying), nor may its contents be communicated to a third party without prior written permission of the copyright holder. The contents are subject to change without prior notice.
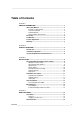
________________________________________________________________________________ Table of Contents CHAPTER 1 GENERAL INFORMATION............................................................................ 3 About This Manual ................................................................... 3 Contents of This Manual ....................................................... 3 Version Information ............................................................... 4 Related Manuals ...............................
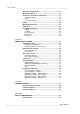
User's Guide ______________________________________________________________________ Observation Time Series .......................................................16 Main User Interface ................................................................17 Text Boxes, Text Labels, and Groups ..................................18 Text Box Settings ................................................................18 Alarms .................................................................................
Chapter 1 ________________________________________________________ General Information CHAPTER 1 GENERAL INFORMATION This chapter provides general notes for the manual and the Vaisala Observation Display software. About This Manual Contents of This Manual This manual consists of the following chapters: - Chapter 1 provides general notes for the Vaisala Observation Display software. - Chapter 2 gives an overview of the application. - Chapter 3 gives instructions on setting up the application and the PC.
User's Guide ______________________________________________________________________ Version Information Table 1 Manual Code M211326EN-A Manual Revisions Description First version of this manual. Related Manuals Table 2 Manual Code M211296EN Related Manuals Manual Name Vaisala Automatic Weather Station AWS330 User's Guide Documentation Conventions Throughout the manual, important safety considerations are highlighted as follows: WARNING Warning alerts you to a serious hazard.
Chapter 1 ________________________________________________________ General Information Recycling Recycle all applicable material. Dispose of batteries and the unit according to statutory regulations. Do not dispose of with regular household refuse. Trademarks Windows is a registered trademark of Microsoft Corporation in the United States and/or other countries. License Agreement All rights to any software are held by Vaisala or third parties.
User's Guide ______________________________________________________________________ This page intentionally left blank.
Chapter 2 __________________________________________________________ Product Overview CHAPTER 2 PRODUCT OVERVIEW This chapter gives an overview of the application. Introduction Vaisala Observation Display is a PC software application intended for displaying and storing meteorological and environmental measurement data. The software can be used as a weather station data display.
User's Guide ______________________________________________________________________ System Requirements and Restrictions Vaisala Observation Display can be used with any of the following Windows® operating systems: XP, 2003 Server, 2008 Server, Vista, and Windows 7. The PC should have at least 512 MB of free memory, a 2.0 GHz processor, and a CD drive. The PC should have at least 512 MB of free memory, a 2.0 GHz processor, and 10 MB of free hard disk space.
Chapter 3 _______________________________________________________________ Installation CHAPTER 3 INSTALLATION This chapter helps you to install and configure the software and provides a checklist for suggested operating system settings. Recommended Operating System Settings To guarantee the best operation, check the following settings from the Control Panel before installing software. Please note that these settings apply to the Window XP operating system.
User's Guide ______________________________________________________________________ System Time It is recommended that you adjust the PC and the weather station clocks to the same time zone. Usually, universal coordinated time (UTC) time is used instead of local time in all meteorological reports. In this case, the PC is set to UTC time zone, too.
Chapter 3 _______________________________________________________________ Installation See also Chapter 5, Administrator's Guide, on page 27 regarding the configuration and testing of communications with automatic weather station. Keyboard If the computer keyboard contains special characters that do not appear on the screen, select local keyboard from Control Panel - Regional and Language Options - Languages - Details.
User's Guide ______________________________________________________________________ Verification Select All Programs - Vaisala - Observation Display from the Start menu. The main application window should open on the screen. You should also see the startup icon on the desktop. Vaisala Background Service should be visible in the Control Panel Administrative Tools - Services pane.
Chapter 3 _______________________________________________________________ Installation 1012-043 Figure 1 5. 6. Communications Settings From the left side list, select item "Miscellaneous". In the screen that opens, select option "Open connection automatically." Click Save and exit the dialog by clicking the Close button. AWS data values should now appear on the main display. You should also see the incoming messages on the terminal window; select View - Terminal from the main menu.
User's Guide ______________________________________________________________________ Miscellaneous Uninstallation Observation Display can be uninstalled using the Add or Remove Programs dialog in the Windows Control Panel. Note that uninstallation does not delete observation data files or application configuration files. These are left into the installation directory. To make a full uninstallation, you have to delete the files manually.
Chapter 4 ____________________________________________________________ Basic Features CHAPTER 4 BASIC FEATURES This chapter contains information for configuring the application. User Roles General Vaisala Observation Display supports two separate user roles: administrator and observer. A user logged in as administrator can change all configuration settings and use all functions in the application. The administrator role is password-protected.
User's Guide ______________________________________________________________________ Data Collection Data collection is handled by a separate Windows background service ("Vaisala Observation Display Service"). The service starts automatically whenever the computer is restarted, even if no one logs into Windows. If the administrator has configured data collection to start automatically, the background service opens the AWS connection and starts processing data.
Chapter 4 ____________________________________________________________ Basic Features Main User Interface A sample of the main user interface displaying the real-time data is shown in Figure 2 below.
User's Guide ______________________________________________________________________ Text Boxes, Text Labels, and Groups A text box displays the latest value of an observation variable. An empty text box indicates that no data has been received. If AWS has been unable to measure or calculate the value, a missing data symbol ('///') is shown. If measurement timeouts are being used, text boxes turn gray if no new data is received within the timeout period.
Chapter 4 ____________________________________________________________ Basic Features Alarm: Configures a visual and/or audible alarm to take place whenever the variable value exceeds the reset limits. Alarm configuration is described in detail in section Alarms below. Visible: Hides/shows the text box. Show Date/Time: Configures text box to display either PC time or observation time. Alarms You can enter the alarm configuration dialog by right-clicking a text box.
User's Guide ______________________________________________________________________ Text Label Settings You can configure text labels by using the following pop-up menu: 1012-048 Figure 6 Text Label Settings Enter Text: Changes the text shown in the label. Visible: Hides/shows the text label. Graphs The real-time graph displays up to 48 hours of observation data. Each graph can contain one to six time series. You can access all graph settings by right-clicking the mouse.
Chapter 4 ____________________________________________________________ Basic Features 1012-050 Figure 8 Example Y-Axis Configuration X-Axis Length: Allows the user to manually set X-axis length. Time Settings: Allows shifting of the measurement time (X-coordinate) by a constant value. This setting can be used to display graph in local time while having the AWS operate in UTC time. The setting only affects the graph.
User's Guide ______________________________________________________________________ Wind Display Element The wind display module shows minimum, maximum, and average wind values. The time span of the wind measurement (10 min/2 min/instant) is user-selectable. Wind display element may optionally contain a ship image (maritime systems) or a runway image (airport/heliport systems).
Chapter 4 ____________________________________________________________ Basic Features Status Bar The status bar is shown at the bottom of the main screen. It contains various status indicators. 1012-052 Figure 10 Status Bar In the rightmost corner, the communications line status is shown. The status turns green if the communications line is open and red if the connection is closed.
User's Guide ______________________________________________________________________ View Menu Commands Settings Opens a window for setting configuration. Only available to an administrator. Terminal The terminal window can be opened from the View menu. The window shows the messages exchanged between the PC and the AWS. In the bottom of the window, the AWS communications parameters are shown.
Chapter 4 ____________________________________________________________ Basic Features History Reports Use the History command to make reports of the observation data. 1012-053 Figure 11 Creating History Report When the History command is selected, a variable selection dialog is shown. Select one or more variables, start and end time, and click the Table or Graph button to generate a tabular or graphical report.
User's Guide ______________________________________________________________________ Data Archive Data archive is made of ASCII log files. Each log file contains AWS variables that have been selected for the logging. Please see Chapter 5, Administrator's Guide, on page 27 for data archive settings.
Chapter 5 _______________________________________________________ Administrator's Guide CHAPTER 5 ADMINISTRATOR'S GUIDE This chapter provides you with information that is intended to help you configure all the settings in the software. Administrator Role Logging in as Administrator When the application is started, the user is automatically given the observer role. From the System menu, select Log in as administrator. Enter the password in the dialog that opens.
User's Guide ______________________________________________________________________ Automatic Functionality While the background service handles most of the automatic functionality of the application, the user interface contains some automatic functions as well.
Chapter 5 _______________________________________________________ Administrator's Guide Directory Structure Installation Directory By default, the application is installed in C:\Program files\Vaisala\Observation Display. The installation directory cannot be changed after the setup. Under the installation directory, there are some subdirectories which may be useful to the administrator.
User's Guide ______________________________________________________________________ Setup Files Observation Display uses a single setup file to load and save all of its operational parameters. The setup file is located in the \Conf subdirectory. The administrator may reload the setup at any time by selecting File Load Setup from the main menu. Loading the setup will undo any unsaved settings changes.
Chapter 5 _______________________________________________________ Administrator's Guide Layout Designer The main real-time display layout can be changed by the administrator. 1012-055 Figure 13 Layout Designer To activate layout editing, select File - Layout Designer from the main menu. When the Layout Designer dialog is open, several new functions become available: - Existing display elements can be moved and resized. - New display elements can be added to the screen.
User's Guide ______________________________________________________________________ Editing Existing Layout When the Layout Designer is open, you can select any screen element for editing by clicking. The selected element is shown with small handles around it as shown in Figure 14 below. 1012-056 Figure 14 Editing Existing Layout Move the selected element anywhere on the screen by dragging it with the mouse. Resize the element by clicking on any of the handles and dragging the mouse.
Chapter 5 _______________________________________________________ Administrator's Guide Adding and Deleting Display Elements There are two ways to add new display elements: 1. 2. You can copy and paste existing elements on the screen. You can select an element type from the Layout Designer and click the Add button. There are two ways to delete existing display elements: 1. 2. Select the element and press the Delete button on the keyboard.
User's Guide ______________________________________________________________________ Configuration Settings You can access all important configuration settings can be accessed from the menu by selecting View - Settings. The configuration screen consists of two main parts: - General settings - Application settings To configure a general setting: 1. 2. 3. Select the General tab on the left side of the screen. Select the category (such as station or variables).
Chapter 5 _______________________________________________________ Administrator's Guide Standard Pressure Level Indicator: Standard isobaric surface for which the geopotential is reported from WMO code table 0264. This parameter is needed only if station is generating WMO synoptic messages. General Settings – Variables 1012-057 Figure 15 General Settings – Variables This section of parameters shows the data of the AWS variables.
User's Guide ______________________________________________________________________ Timeout: Time (in seconds) after which a user interface element (text box, wind display element) indicates that variable is missing if no new value has been received from the AWS. Note that the timeout should be at least as long as is the interval between two AWS messages. For unit conversions, see section Observation Time Series on page 16.
Chapter 5 _______________________________________________________ Administrator's Guide If Serial port is selected, Observation Display connects to the selected serial port. Note that virtual serial ports can also be used as long as the operating system treats them as serial interfaces. If the weather station sends data automatically, any of the three communications types can be used. If data is to be polled, TCP/IP client or serial communications should be used.
User's Guide ______________________________________________________________________ Application Settings – Data Logging The application supports several ways to generate ASCII files from the received data. 1012-059 Figure 17 Application Settings – Data Logging Log groups can be utilized to store received data in ASCII files. A log group may contain one or more AWS variables. The received variables automatically saved into log files, under the \log subdirectory. Each group has its own set of files.
Chapter 5 _______________________________________________________ Administrator's Guide Application Settings – Data Transfer 1012-060 Figure 18 Application Settings – Data Transfer This dialog contains settings for sending the latest data files to another PC. The user may select either FTP or SFTP protocol to transfer files. It is possible to forward the files to one or two FTP/SFTP servers. To test the connection settings manually, click the Test button.
User's Guide ______________________________________________________________________ Application Settings – Miscellaneous 1012-061 Figure 19 Application Settings – Miscellaneous This dialog contains miscellaneous settings. Start-up actions can be used reduce manual work when launching the application. Selecting the Log in as administrator automatically option gives all users the possibility to change settings.
Chapter 5 _______________________________________________________ Administrator's Guide Clients must connect to the Observation Display PC at the port indicated in the text box. For instance, to test a client Observation Display connection from a client PC to a master PC: 1. 2. 3. 4. Make sure that the master Observation Display is running connected to the AWS and receiving data. Select Distribute data to TCP clients on the master PC.
User's Guide ______________________________________________________________________ This page intentionally left blank.
Chapter 6 ___________________________________________________________ Troubleshooting CHAPTER 6 TROUBLESHOOTING This chapter describes common problems, their probable causes and remedies, and contact information for technical support.
User's Guide ______________________________________________________________________ Problem Situations Table 5 Some Problem Situations and Their Remedies Problem User cannot open "Settings" menu. Application cannot connect to the AWS. Data does not appear in Vaisala Observation Display or the external terminal. AWS data messages can be seen in external terminal (for example, HyperTerminal) but no data is visible in Observation Display.
Appendix A _____________________________________________________ AWS330 Configuration APPENDIX A AWS330 CONFIGURATION Vaisala Automatic Weather Station AWS330 is preconfigured, and there is no need to make any configuration changes to take Observation Display software into use. Report Format The report format used for communication between Observation Display and the weather station is called SMSAWS. Lizard Setup Software provides automated tools for generating reports in the correct format.
User's Guide ______________________________________________________________________ - Tag "D" is reserved for date, which must be in format YYMMDD. The first two characters identify the year, the next two characters identify the month, and the last two characters identify the day. - Tag "T" is reserved for time, which must be in format HHMMSS. First two characters identify the hour (24-hour format), next two characters the minute and last two characters the second.
www.vaisala.