
Technical data


Algorithm Optimization Examples
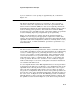
Figure A–1 Linpack Performance Graph, Double-Precision BLAS Algorithms
Refer to the printed version of this book, EK–60VAA–PG.
For the Linpack 300 by 300 benchmark, optimizations include the use
of routines that are equivalent to matrix-vector level 2 BLAS routines.
Example A–2 details the core loop of a BLAS 2 routine. BLAS 2 routines
make better use of cache and translation buffers than the BLAS 1
routines do. Also, BLAS 2 routines have a better ratio between vector
arithmetics and vector load and stores. The larger matrix size increases
the average vector length. Performance is improved by amortizing the
time to decode instructions across a larger work load.
By removing one vector load and one vector store from the innermost loop,
the BLAS 2 routine has a better ratio of arithmetic operations to load and
store operations than BLAS 1 routines. Although the 300 by 300 array
fits into the vector processor’s 1-Mbyte cache, not all the cache can be
mapped by its translation buffer. By changing the sequence in which this
routine is called in the program, the data access patterns can be altered to
better use the vector unit’s translation buffer. Thus, higher performance
is obtained.
The percent of vectorization increases primarily because of the increase
in the matrix size from 100 by 100 to 300 by 300. With a vector fraction
of approximately 95 percent, Figure A–1 shows the speedup improvement
in the 300 by 300 benchmark when using methods based on BLAS 2
routines. With a matrix vector algorithm, the 300 by 300 benchmark
yields speedups of between 10 and 12 over its scalar counterpart.
A–4