
User's Manual Part 1


106 APCD-LM043-8.0 (DRAFT C)
6: Installation & Diagnostic Tools
replyOrRssiTimeouts: 25
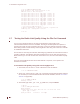
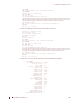
7. At the EUM, use the stats summary command to view the EUM statistics.
60:ff:fe> stats summary
----------------- MAC Summary ---------------------------------
Transmitted Payloads
1Ok : 921 89.8%
2Ok : 99 9.6%
3Ok : 5 0.4%
4Ok : 0 0.0%
Fail Retry : 0 0.0%
Fail Timeout : 0
Received Packets
HCRC Error : 2 0.0%
Directed : 3955 56.0%
Broadcast : 3097 43.9%
No Match : 0 0.0%
Received Payloads
FCS Error : 102 6.3%
Duplicate : 36 2.2%
Too Busy - Discard : 0 0.0%
Delivered : 1467 91.4%
60:ff:fe>
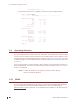
6.9 Operating Statistics
The CCU and EUM collect a wide range of IP, radio, MAC, and network layer statistics, which
can be used for measuring system performance and troubleshooting. These statistics can be
accessed through the command line interface, outlined in Appendix C on page 189 or by using
an SNMP manager. A list of available statistics and their meanings can be found in Appendix J
on page 277.
The CCU also includes a “watch” command, which enables you to monitor link statistics for a
single specified EUM. For instructions about using the watch command, refer to
CCU Watch
Statistics
on page 298.
NOTE: A subset of all statistics are logged at regular intervals, allowing
checks on historical operation.
6.10 SNMP
The CCU and EUM are SNMP-ready. To make use of the CCU and EUM SNMP capabilities,
you must obtain the associated WaveRider MIBs from the technical support page at
www.waverider.com
and install them on your SNMP manager (SNMPc, or HP OpenView, for
example).