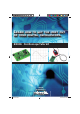
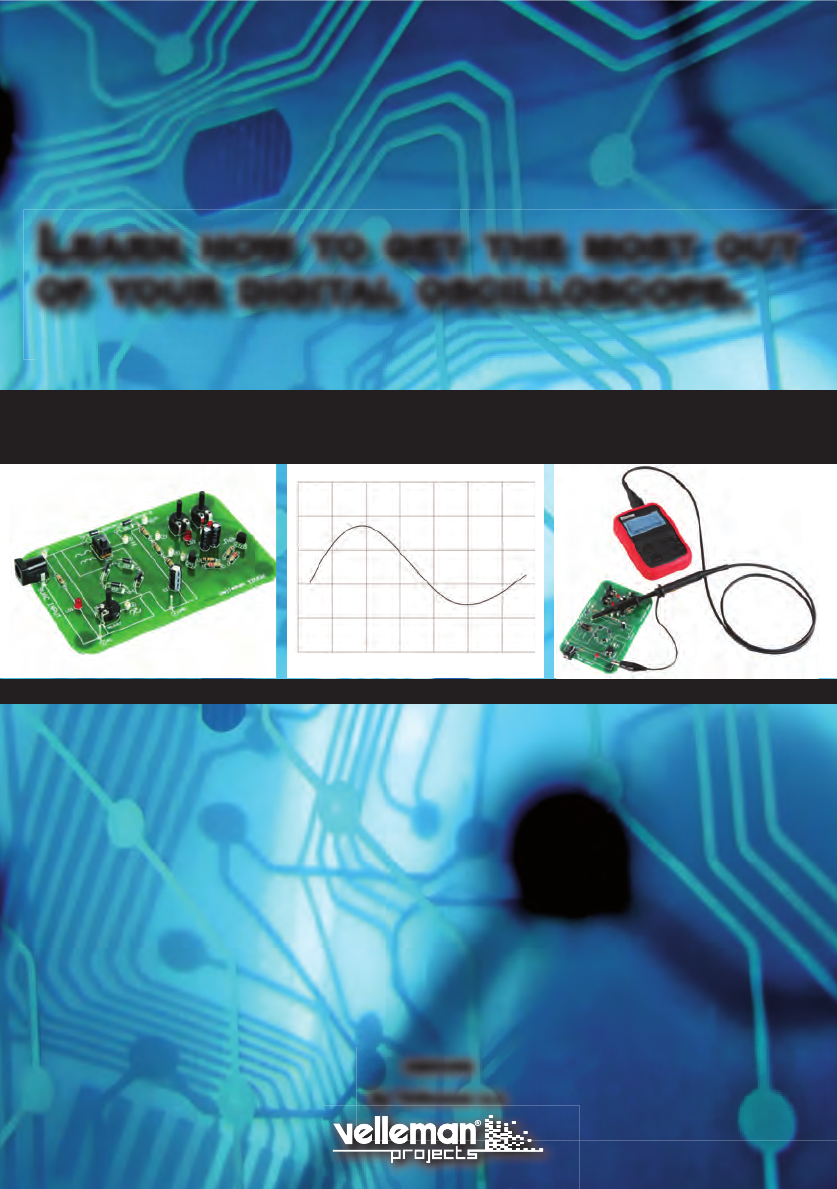
LEARN HOW TO GET THE MOST OUT OF YOUR DIGITAL OSCILLOSCOPE. EDU06 Oscilloscope Tutor kit HEDU06 By Velleman n.v.
Getting started The purpose of this board is to learn how to perform basic measurements with an oscilloscope. Most experiments can be performed with any digital storage scope. Some experiments can be performed with an analog scope. Experiments in this project are performed using the Velleman HPS140 Handheld Pocket Scope. All experiments require basic knowledge of terms such as AC and DC voltage, current, resistance, etc… Make sure to check You Tube as well, it features a short movie for each experiment.
Contents Getting started ..................................................................................................................................................... 2 Oscilloscope basics ............................................................................................................................................ 4 Analog versus digital: .....................................................................................................................................................
Oscilloscope basics Oscilloscope basics While a multimeter shows an instant voltage level or an average voltage level, an oscilloscope is capable of displaying voltage levels over a period of time. Voltage is displayed vertically (X-axis) versus time (Y-axis). Oscilloscopes can be used to for applications such as: • Looking at the shape of a signal. • Measuring the amplitude and frequency of a signal. • Measuring the time between to events.
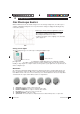
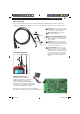
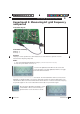
Oscilloscope basics 5 Measuring probe: To be able to display waveforms, we need to connect the signal to the input of the oscilloscope. Similar to a multimeter, the oscilloscope uses a measurement lead, but here it is called a ‘probe’. 1 Probe tip: The (+) of your probe. It is needle-shaped to ensure a good electrical contact with your measuring point. 3 2 BNC connector: Connects to the input of your oscilloscope. 3 Ground lead with alligator clip: The (-) of your probe.
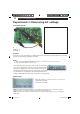
Exp.1: measuring AC voltage Experiment 1: Measuring AC voltage Connection layout: NOTES: Connection summary: GND clip : 2 Probe tip : 1 Purpose: The purpose of this experiment is to display and measure AC voltage. In this particular case, we will measure the AC voltage supplied to the board. How?: 1. Turn on the HPS140 Handheld Pocket Scope (see HPS140 manual for How-To instructions). 2. Place the probe switch “x1/x10” to ‘x1’. The unit always starts up in ‘auto-setup’ mode.
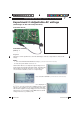
Exp.2: Adjustable AC voltage (advantages of the auto-setup function) 7 Experiment 2: Adjustable AC voltage (advantages of the auto-setup function) Connection layout: y NOTES: Connection summary:: GND clip : 2 Probe tip : 3 Purpose: The purpose of this experiment is to show the advantages of the auto-setup function to measure AC voltage. How?: 1. Turn on the HPS140 Handheld Pocket Scope (see HPS140 manual for How-To instructions). 2. Place the probe switch “x1/x10” to ‘x1’.
Exp.2: Adjustable AC voltage (advantages of the auto-setup function) T Turn RV1 a little further clockwise. The signal goes offsscreen and the Vrms readout displays ?????mV, because tthe unit is no longer capable of calculating the correct Vrms. How can we display the current signal correctly again? Increase the V/div setting to 0.1V/div. As you will see, the signal fits the screen again. If you turn RV1 clockwise again, the signal will go off screen again. Changing V/div to 0.
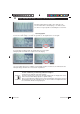
Measuring AC grid frequency and period 9 Experiment 3: Measuring AC grid frequency and period Connection layout: NOTES: Connection summary: GND clip : 2 Probe tip : 3 Purpose: The purpose of this experiment is to demonstrate the use of the markers to perform on-screen measurement of frequency and period. How?: 1. Turn on the HPS140 Handheld Pocket Scope (see HPS140 manual for How-To instructions). 2. Place the probe switch “x1/x10” to ‘x1’.
Measuring AC grid frequency and period P Press the upper right button again to select vertical marker 2. Use the arrow keys to position tthis marker at the exact same location but further to the right of the screen. You have now selected one period or cycle of the Y wa displayed waveform. In the lower right corner, the unit displays the time between the two markers. In most cases, this will be 20ms (16.66ms). The value displayed is called the period of a waveform, i.e.
Rectified AC, single phase 11 Experiment 4: Rectified AC, single phase Connection layout: NOTES: Connection summary: GND clip : 4 Probe tip : 5 Purpose: The purpose of this experiment is to show what single phase rectified AC looks like on a scope screen. How?: 1. Turn on the HPS140 Handheld Pocket Scope (see HPS140 manual for How-To instructions). 2. Place the probe switch “x1/x10” to ‘x1’. 3. Make sure to flip SW1 to the correct position Select 5ms/div and 4V/div.
Rectified AC, dual phase Experiment 5: Rectified AC, dual phase Connection layout: NOTES: Connection summary: GND clip : 4 Probe tip : 5 Purpose: The purpose of this experiment is to show what dual phase rectified AC looks like on a scope screen and to show the difference with single phase rectified AC. How?: 1. Turn on the HPS140 Handheld Pocket Scope (see HPS140 manual for How-To instructions). 2. Place the probe switch “x1/x10” to ‘x1’. Select 5ms/div and 4V/div.
Rectified AC, dual phase 13 Now, check what happens when you flip the switch from single phase to dual phase rectification. n. Flip the switch back and forward, to clearly see the difference between both settings. A little theory: As you can see, the ‘interruptions’ we have noticed with single phase rectification are gone. As opposed to single phase rectification, both halves of the sine wave are used.
Smoothed versus unsmoothed DC (ripple) Experiment 6: Smoothed versus unsmoothed DC (ripple) Connection layout: NOTES: Connection summary: GND clip : 4 Probe tip : 6 Purpose: The purpose of this experiment is to show what smoothed and unsmoothed DC looks like on a scope screen and how a scope can help you to determine the quality of your DC supply. A little theory: In the previous experiments, we have used one or more diodes to convert an AC voltage into a DC voltage.
Smoothed versus unsmoothed DC (ripple) 15 Can we measure this amount of ripple? Yes we can, a scope is the ideal tool for ripple measurement. Flip SW1 back to single phase rectification. Default, your scope starts up with ‘DC-coupling’ selected. D Change that to ‘AC-coupling’ (see manual for how-to instructions). C Now, the scope will only show the AC part of the signal, the DC part will be blocked. Make sure it is still in ‘auto-setup’ mode.
DC measurement Experiment 7: DC measurement Connection layout: NOTES: Connection C onnection summary: GND G ND clip : 4 Probe tip : 6 Purpose: The purpose of this experiment is to show that a scope is also suited to measure DC voltages. In general, scopes are used to measure AC voltages. For DC voltages, a multimeter is fine. However, if you don’t have a multimeter at hand, you can still perform DC measurements with a scope. MAKE SURE THE SCOPE IS SET UP CORRECTLY FOR DC MEASUREMENTS How?: 1.
DC measurement 17 Set the DC reference: To T set the DC reference, set the input coupling to GND and wait w a couple of seconds, until the DC readout in the lower right hand corner displays ‘0.0mV’. h If the settings have been performed correctly, your scope will now show a flat trace above the centre of the screen and the readout in the bottom right hand corner will show the measured DC voltage. Don’t forget to switch it back to ‘DC coupling’ again.
Waveform with adjustable frequency Experiment 8: Waveform with adjustable frequency Connection layout: y NOTES: Connection summary: GND clip : 4 Probe tip : 9 Purpose: The purpose of this experiment is to demonstrate the use of the ‘trigger’-function. How?: 1. Place the probe switch “x1/x10” to ‘x1’. 2. Flip SW1 into the ‘full wave’-position. 3. Turn on the HPS140 Handheld Pocket Scope, it will turn on in ‘auto-setup’ mode. Select DC coupling. Set unit to 10ms/div and 2V/div.
Waveform with adjustable frequency 19 Exercise: Press and hold the upper right hand button, to enter the menu. Release and press again a number of times until ‘Trg Level’ is highlighted. Wait until unit quits the menu. N look at the bottom left hand side of the screen, the trigger Now s symbol is displayed. T arrow buttons allow you to shift the trigger level up or The down. Check out what happens if you move it al the way down.
Glossary GLOSSARY 3 6 4 8 7 1. Volts/div: Determines how many volts the signal at the input must swing for the trace to move one division. 2. Time/div: Determines the time the trace needs to scan from the the left hand side to the right hand side of a division. 3. Division: Imaginary or visible grid on the oscilloscope screen. It helps estimating signal amplitude and period. 4. Period (T): Duration of one cycle of the AC waveform (= 1/f) 5.
Glossary 21 Noise: Undesired random addition to a signal. Ripple: Unwanted periodic variation of a DC voltage. Signal: Voltage applied to the input of the oscilloscope. The subject of your measurement. Sine wave: Mathematical function that represents a smooth repetitive oscillation. The waveform shown at the start of this glossary is a sine wave. Spikes: Fast, short duration transients in a signal.
SW DCJACK DC JACK SK11 - + LD1 R1 10K SK6 SK2 RV RV1 100K SK1 1N4007 SW1 SW D2 1N4007 D1 1N4007 D4 1N4007 D3 1N4007 D6 D5 1N4007 SK3 SK7 C1 100µ/25V SK4 R6 10K R3 10K R2 10K SK8 SK5 T1 BC547 SK9 LD2 LED3RL C2 1µ R7 2K2 R4 10K RV2 RV 100K C3 1µ R5 10K RV3 RV 100K T2 BC547 R8 2K2 SK10 LD3 LED3RL 22 Diagram
PCSU200: USB PC Oscilloscope and Signal Generator Pocket size PC oscilloscope and function generator. This small box contains a world of measuring tools! From generating signals to a powerful 2 channel oscilloscope and a handy bode plot function. No need for a power supply since the unit iss powered over USB HPS1 HPS140: HANDHELD POCKET SCOPE POCK POC 40MS/s 40MS S/ Do nott let le its size fool you! This Oscillos scop packs a lot of power in Oscilloscope a tiny bo ox. Now you can really take a box.
13+ The board generates a number of safe ‘real-world’ signals, which we will use to perform measurements. Get familiarized with AC, DC and frequency measurements, sine and square waves, power supply ripple, full and half wave rectifiers, oscillators etc… Learn what terms such as V/div, Time/div, trigger level, auto-setup etc… mean. All experiments featured in this project are performed with the Velleman. Most experiments can be done with any digital storage scope.