DSO USERMANUAL PCSU1000
I PC Oscilloscope PCSU1000 Table of Contents Foreword 0 2 Part I Contents 1 Safety Instructions ................................................................................................................................... 2 2 1GS/s oversampling ................................................................................................................................... mode 3 3 Controls ........................................................................................................
Contents 1 2 Contents Operation Instructions for Velleman PC Oscilloscope PCSU1000 · DIGITAL STORAGE PC OSCILLOSCOPE · FFT SPECTRUM ANALYZER Safety Instructions 1GS/s sampling mode Controls Connection Waveform Parameters Display Troubleshooting Adding comment text in the signal screen Menu Options Spectral Density marker Data acquisition to other applications Data acquisition to Microsoft Excel 1.1 Safety Instructions SAFETY and WARNINGS ! Important safety information, see user manual.
3 1.2 PC Oscilloscope PCSU1000 1GS/s oversampling mode · The 1GS/s sampling rate is in use on blue 0.2us/div, 0.1us/div, 0.05us/div and 0.02us/div ranges. · Triggering must be ON to get stable waveform images. · This mode is useable only for repetitive signals. · This operation mode is called "Random Interleaved Sampling" (RIS) method, sometimes also called "Equivalwent Time Sampling" (ET) mode or "Random Repetitive Sampling".
Contents 4 Autoset Automatic setup for the Volts/div, Time/div, and Trigger level to produce a stable waveform of usable size. The trigger will be set on if the wave aplitude on the screen is more then 0.5 divisions. The signal should be repetitive for proper autoset function: Amplitude 5mV to 100V; frequency above 50Hz; duty cycle greater than 10%. Persist When this button is down the scope captures many acquisitions of a signal to the screen. Record points accumulate until you release the button.
5 PC Oscilloscope PCSU1000 TIME/DIV Selects the time setting for the beam to sweep one major division on the screen By selecting different TIME/DIV settings it is possible to zoom the frozen waveform on the screen. TRIGGER On/Off Selects free run mode or trigged mode. TRIGGER Level Selects the signal level at which the sweep is triggered. Triggering reference mark is displayed with the horizontal line on the left side of the screen.
Contents 1.5 6 Troubleshooting Spectrum analyzer doesn't work. · No arithmetic coprocessor in the computer. No signal on the oscilloscope display · No communication with the computer (check that the cable is connected to the USB port) · If USB cable is connected, close the program. Disconnect and reconnect the USB cable and run the Pc-Lab2000 program again. · · · · · · · RUN button is not ON. The channel concerned is OFF. TIME/DIV switch is in the wrong setting.
7 PC Oscilloscope PCSU1000 Voltage parameters DC Mean The arithmetic mean of the entire waveform data. Max The signal's positive peak voltage. (Difference between zero and highest value.) Min The signal's negative peak voltage. (Difference between zero and lowest value.) Peak-to-Peak The signal's peak-to-peak voltage. (Difference between highest and lowest value.) High The statistical maximum level recorded for all the cycles in the signal.
Contents 8 Time parameters Duty Cycle The ratio (expressed as a percentage) of the average positive pulse width to the average period of the signal. The time intervals are determined at middle reference level. Duty Cycle = (Positive Pulse Width)/Period x 100% Positive Width Average positive pulse width in the waveform. The time intervals are determined at middle reference level. The middle reference is the middle point between the high and low levels.
9 1.7 PC Oscilloscope PCSU1000 Add comment text in the signal screen For explanation and documentation, each measurement can be supplied with a comment text. This text will be saved together with the waveform data to the disk file. To enter the text: 1. Right mouse click into the screen. 2. Text box will open, to write your comment. 3. Click Add Text on Screen or Remove to remove previously inserted text. 4. Right click on the screen to position your text. 5. Click Close.
Menu Options 10 Print Prints the image in color. You can edit the image caption. Print Setup Selects a printer and sets printer options before printing. The available options depend on the printer you select. Exit Terminates the program. Calibrate & Exit Makes the oscilloscope calibration, saves the calibration values to the WinDSO.INI file and terminates the program. This option should be used when the new oscilloscope has been on for about 1h. This option performs following operations: 1.
11 PC Oscilloscope PCSU1000 if the amplitudes are very different, a window with low sidelobes will reduce leakage around the large component, and should make the small one easier to detect.
Menu Options 12 Select the LPT port address where the Function Generator PCG10 or K8016 is connected 378, 278 or 3BC You'll find the address from Windows' Device Manager: 1. Click "System" icon in Control Panel and then the Device Manager tab. 2. Click the plus sign next to the "Ports". 3. Double-click "Printer Port (LPTx)". 4. Click the Resources tab to see the Input/Output address. Select the LPT port communication speed for the Function Generator Normal This can be used in most cases.
13 PC Oscilloscope PCSU1000 Waveform Parameters Software automatically calculates various voltage and time parameters of a signal, such as DC mean, amplitude, rise time etc. These parameters are displayed in a separate window. Use the check boxes in the window to select the parameters you which to be displayed. Markers Displays Markers on the screen. Bright Grid Brightens the signal grid on the screen. Dot Join On: The dots of the acquired waveform data are connected by lines.
Menu Options 14 dBm A unit of measurement of signal level in an electrical circuit, expressed in decibels referenced to 1 milliwatt. In a circuit with an impedance of 600 ohms, 0 dBm gives an equivalent voltage level of 0.775 Vrms. The dBm value displayed on the screen: 0 dBm = 1 milliwatt at 600 ohms ( 0.775 Vrms) 2.
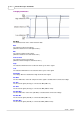
15 PC Oscilloscope PCSU1000 · View / Markers (FFT) f & Spectral Density dBV/sqrt(Hz) This image shows the spectrum of the band limited noise signal. The analysis of noise in the frequency domain shows the distribution of the noise amplitude as a function of frequency. Using the Spectral Density marker and the Frequency marker, the voltage spectral density (VSdBV) and the noise bandwidth (BN) can be read from the spectrum analyzer display. First convert the voltage spectral density to .
Menu Options 2.6 16 Math Menu The result of mathematical operation of channel 1 and 2 is displayed. One of the following functions can be selected: · · · · Ch1 + Ch2 Ch1 - Ch2 XY Plot Invert Ch2 XY Plot: Ch1 data is displayed on Y axis Ch2 data is displayed on X axis A button is provided to toggle between Math mode and Normal mode. 2.
17 PC Oscilloscope PCSU1000 Description of the procedures of the DSOLink.DLL ReadCh1 ReadCh2 Syntax PROCEDURE ReadCh1(Buffer: Pointer); PROCEDURE ReadCh2(Buffer: Pointer); Parameter Buffer: A pointer to the data array of 5000 long integers where the data will be read. Description Read all the data and the settings of channel 1 or channel 2 of the PCSU1000. As a return the following data is put to the buffer: [0] : Sample rate in Hz [1] : Full scale voltage in mV [2] : Ground level in A/D converter counts.
Data Transfer Option Explicit Dim DataBuffer(0 To 5000) As Long Private Declare Sub ReadCh1 Lib "DSOLink.dll " (Buffer As Long) 'This reads the settingsd and 4096 bytes of data from CH1 to the data buffer. 'The first 21 values are displayed. Private Sub Read_CH1_Click(Index As Integer) Dim i As Long List1.Clear ReadCh1 DataBuffer(0) List1.AddItem "Sample rate [Hz]" + Chr(9) + Str(DataBuffer(0)) List1.AddItem "Full scale [mV]" + Chr(9) + Str(DataBuffer(1)) List1.
19 PC Oscilloscope PCSU1000 { int data[5000]; ReadCh1(data); Memo1->Clear(); Memo1->Lines->Add("Sample rate [Hz]: "+IntToStr(data[0])); Memo1->Lines->Add("Full scale [mV]: "+IntToStr(data[1])); Memo1->Lines->Add("GND level [counts]: "+IntToStr(data[2])); Memo1->Lines->Add(""); for (int i = 0; i < 20; i++) { Memo1->Lines->Add("Data "+IntToStr(i)+char(9)+IntToStr(data[i+3])); } } //--------------------------------------------------------------------------- Note: If the import library is not compatible to y
Data Transfer 3.2 20 Data acquisition to Microsoft Excel Pc-Lab2000 software package includes a DLL (Dynamic Link Library) DSOLink.DLL, installed to Windows' SYSTEM32 folder. This DLL allows you to write custom applications in Excel, Visual Basic, Delphi or any other 32-bit Windows application development tool that supports calls to a DLL.
21 PC Oscilloscope PCSU1000 Sub ReadAll() Dim i As Long ReadCh1 DataBuffer1(0) ReadCh2 DataBuffer2(0) With ActiveSheet For i = 0 To 99 .Cells(i + 1, 2) = DataBuffer1(i) .Cells(i + 1, 3) = DataBuffer2(i) Next i End With End Sub 6. 7. Press Alt+F11 to return to Excel. Type following texts to column A: Sample rate [Hz] Full scale [mV] GND level [counts] Data 0 Data 1 Data 2 ... 8. 9. Start oscilloscope program for PCSU1000, PCS500, PCS100 or K8031 and click Run or Single button.
Data Transfer 22 The three first rows contain the scope settings and the rest of the rows contain the raw oscilloscope data in A/D converter counts (0...255). Using the Sample rate, Full scale and GND level values it is possible to reconstruct the waveform data into engineering units (e.g. Volts and seconds) for further analysis. © 2005 ...