
Manual

PC Oscilloscope PCSU100015
© 2005 ... Velleman
·
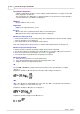
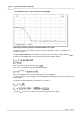
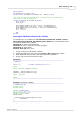
View / Markers (FFT) f & Spectral Density dBV/sqrt(Hz)
This image shows the spectrum of the band limited noise signal.
The analysis of noise in the frequency domain shows the distribution of the noise amplitude as a
function of frequency.
Using the
Spectral Density
marker and the Frequency marker, the voltage spectral density (V
SdBV
)
and the noise bandwidth (B
N
) can be read from the spectrum analyzer display.
First convert the voltage spectral density to
.
This can be accomplished using the following calculation:
This is the magnitude of the spectrum normalized to a 1 Hz bandwidth.
You may calculate the noise voltage over any bandwidth by multiplying this value by the square root of
the bandwidth.
Assuming a 6 kHz bandwidth, the total output noise voltage is:
(See the V
rms
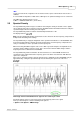
value of the oscilloscope waveform image of this noise signal.)