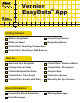
Vernier TM EasyData App Getting Started What is EasyData? Connecting Devices What you Need Navigating Menus Quick Start: Graphing Temperature Quick Start: Graphing a Ball Bounce How To....
What is the EasyData App The EasyData App is a graphing calculator application. It lets you collect, view, and analyze real-world data on certain TI-graphing calculators using Vernier USB devices (EasyTemp and EasyLink) and other data collection devices, such as Texas Instruments CBR 2™ motion detector, CBL 2™ System, or Vernier Go!Motion™, and LabPro®. What You Need Note: In this guidebook, references to TI-83 Plus also apply to the TI-83 Plus Silver Edition.
Connecting devices There are several data-collection devices that can be used with EasyData. These devices include the CBL 2, LabPro®, CBR™, CBR 2, Go!™ Motion, and the Vernier EasyTemp and EasyLink. For more information on connecting data-collection devices, please refer to the device's user guide. When the calculator detects a data collection device connected to the USB port, EasyData opens automatically and starts a default experiment appropriate for that device.
Starting and Quitting the EasyData App Note: EasyData starts automatically when you connect a sensor to the USB port of a TI-84 Plus calculator that is on the home screen. Starting EasyData ► If EasyData is not already running on your calculator, to display the list of available applications, press and then select EasyData. The application’s information screen is displayed for about three seconds, followed by the main screen. Quitting EasyData 1. Select from the main screen.
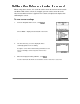
Changing a Sensor’s Measuring Unit You can change the measuring unit for a connected sensor. With a temperature probe, for example, you can change the unit from Celsius (°C) to Fahrenheit (°F). To change the measuring unit 1. From the EasyData main screen, select . Choose the sensor displayed at the top of the menu, such as Temp for the temperature probe. . 2. The Sensor Setup screen is displayed. Select . . 3. A menu is displayed showing the possible units for the connected sensor.
Setting a Zero Reference (zeroing the sensor) When using some sensors, it is useful to set the sensor to read zero under certain conditions. With a force sensor, for example, you can set the sensor to read a value of zero when no force is applied. This is often as helpful, and simpler, than calibrating the sensor. To zero sensor readings 1. From the EasyData main screen, select . Choose Zero… displayed at the bottom of the menu. . 2.
Restoring EasyData Default Settings The default EasyData settings are appropriate for a wide variety of sampling situations. If you are unsure of the best settings, begin with the default settings, and then adjust the settings for your specific activity. 1. Make sure an Auto-ID sensor is connected. 2. Select , from the main screen and choose New. EasyData restarts in the default data-collection mode, and the default settings are restored. Note: All unsaved data is also erased.
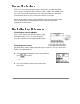
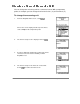
Quick Start: Graphing Temperature with Vernier EasyTemp ™ You can connect the EasyTemp™ USB temperature sensor to a TI-84 Plus calculator and use EasyData to watch the effect of holding the sensor in your hand. This exercise uses the Time Graph mode to collect samples automatically at regular time intervals. 1. Turn the TI-84 Plus calculator on, and display the home screen. 2. Connect the EasyTemp sensor to the calculator. After a few seconds, the EasyData main screen is displayed.
8. Select 9. Select to quit EasyData. . A message notes the lists in which the data can be found. You have completed the Quick Start exercise for collecting temperature. To learn how to collect data with a motion sensor, complete the Quick Start exercise for collecting motion data. The remainder of this guide contains detailed instructions and reference information for using EasyData features.
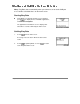
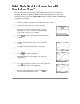
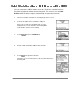
Quick Start: Graphing a Ball Bounce with a CBR 2 You can connect the CBR 2 motion sensor to a TI-84 Plus calculator and use EasyData to graph the motion of a bouncing ball. This exercise uses the Ball Bounce mode to collect samples automatically at regular time intervals. 1. Turn the TI-84 Plus calculator on, and display the home screen. 2. Connect the CBR 2 to the calculator’s USB port. After a few seconds, the EasyData main screen is displayed.
6. Once the motion data has been transferred, a graph of the ball’s motion is displayed. 7. Identify a bounce on the graph with a uniform shape to it. and choose Select Region from the Select analyze menu. A Region Select warning message will be displayed. . Select 8. repeatedly to scroll the cursor to the Press to set your beginning of a uniform bounce. Select left boundary marker. repeatedly to scroll the cursor to the end of Press to set your right the uniform bounce. Select boundary marker.
Collecting Multiple Data Runs In order to compare consecutive runs of data, it is necessary to store your current data before performing the next data-collection trial. When collecting data with a single sensor, EasyData will allow you to store two runs of previous data for comparison and analysis with your current data. Each time a run is stored, list L3 is copied into L4 and list L2 is copied into L3.
Data Collection Modes EasyData has several modes that let you collect data automatically or manually. The five most common modes are listed below. In Time Graph mode, EasyData automatically collects a specific number of samples at regular time intervals. You set the interval (in seconds) and the total number of samples to collect. You can stop the sampling manually, if you wish. In Events with Entry mode, you capture samples manually for a set of events that you define.
Collecting Data Automatically (Time Graph) To collect data in the Time Graph mode This example uses a force sensor connected to an EasyLink and a TI-84 Plus calculator. Your screens will vary depending on which sensor and data-collection device is attached. 1. Turn the calculator on, and start the EasyData app. After a few seconds, the EasyData main screen is displayed. The screen shows the current EasyData mode and the current sensor reading. The default mode for most sensors is Time Graph. 2.
To change Time Graph settings This example uses a force sensor connected to an EasyLink and a TI-84 Plus calculator. Your screens will vary depending on which sensor and data-collection device is attached. 1. From the EasyData main screen, select , and then select Time Graph.. to open the Time Graph Settings wizard. The current Time Graph settings are displayed. 2. Select to enter new Time Graph settings beginning with the sample interval.
Collecting Data Manually (Events with Entry) In Events with Entry mode, each reading collected from a sensor becomes a y value. After each reading, EasyData prompts you to enter the corresponding x value. To collect data in Events with Entry mode This example uses a gas pressure sensor connected to an EasyLink and a TI-84 Plus calculator. Your screens will vary depending on which sensor and datacollection device is attached. 1. Turn the calculator on, and start the EasyData app.
You are prompted to type in an x value that corresponds to the sample you just collected. Enter it and select to prepare for the next sample. 5. Repeat the above step for each additional sample to be collected. 6. When you have finished collecting data, select . The data you have collected are displayed as a graph. 7. 16 or to review your data, or select Press return to the EasyData main screen.
Collecting Data Manually (Selected Events) In Selected Events mode, each reading collected from a sensor becomes a y value. EasyData automatically assigns the sample number as the x value. To collect data in Selected Events mode This example uses a pH sensor connected to an EasyLink and a TI-84 Plus calculator. Your screens will vary depending on which sensor and data-collection device is attached. 1. Turn the calculator on, and start the EasyData app.
18 5. Repeat the above step for each additional sample to be collected. 6. When you have finished collecting data, select 7. The data you have collected are displayed as a graph. or to review your data, or select to Press return to the EasyData main screen. .
Collecting Data Manually (Single Point) In Single Point mode, EasyData samples readings from the sensor for a 10 second period. When sampling is finished, the mean reading is calculated and displayed. Each time a reading is collected, it is stored in memory for future use. If you wish to clear previously collected data, select New from the File menu. To collect data in Single Point mode This example uses an EasyTemp and a TI-84 Plus calculator.
Specialized Data Collection Modes Using Motion Detectors In Distance Match mode, EasyData helps to build understanding of graphs by letting you try to create data that matches a predefined graph. The sample interval and number of samples are preset and cannot be changed. Each of the preset plots is randomly generated so that students have the option of matching a new plot every time. In Velocity Match mode, students work to match preset plots of velocity rather than distance.
To collect data in Distance Match This example uses a CBR 2 connected to a TI-84 Plus calculator. 1. From the EasyData main screen, select then select Distance Match. , and 2. Select 3. Follow the instructions displayed in the Graph Match to display the next screen. dialog box. Select 4. A graph of distance vs. time is displayed. The graph should be examined before attempting to match the graph. When ready to perform the match, select to begin collecting data. to begin the activity.
5. 22 Select to display a new graph to match, or select to match the same graph already displayed. to return to the main When finished, select screen.
To collect data in Velocity Match This example uses a CBR 2 connected to a TI-84 Plus calculator. 1. From the EasyData main screen, select then select Velocity Match. , and 2. Select 3. Follow the instructions displayed in the Graph Match to display the next screen. dialog box. Select 4. A graph of velocity vs. time is displayed. The graph should be examined before attempting to match the graph. When ready to perform the match, select to begin collecting data. to begin the activity.
5. 24 Select to display a new graph to match, or select to match the same graph already displayed. to return to the main When finished, select screen.
To collect data in Ball Bounce This example uses a CBR 2 connected to a TI-84 Plus calculator. 1. From the EasyData main screen, select then select Ball Bounce. 2. Pick up a ball and hold the CBR 2 above the ball. to begin data collection. Select 3. Follow the instructions displayed in the Ball Bounce dialog box. to display the next screen.
4. Once the motion data has been transferred, a graph of the ball’s motion is displayed. Scroll through the collected data points on the graph screen using the keys. and to display a plot of velocity or acceleration, Select to analyze the displayed graph. When or select to return to the main screen.
Using Photogates When a photogate is attached, there are four photogate data collection modes that can be used. These data-collection modes are only available when a photogate is set up. Photogates cannot be used in conjunction with any other sensors and must be connected to the digital (DIG) channels of the LabPro or CBL 2. When using an older photogate, it may not auto-ID and it will be necessary to set up your photogate manually.
To collect data in Motion Timing mode This example uses a photogate connected to a CBL 2. During the experiment, a Vernier Picket Fence is dropped through the photogate. 1. From the EasyData main screen, select then select Motion Timing.... , and The default Motion Timing settings are displayed. The default device should be set as a Vernier Picket Fence. to return to the main screen. Select 28 2. to begin collecting data.
Options: To use a device other than a Vernier Picket Fence, select Timing Settings dialog box and select one of the following. from the Motion Pulley (Outside Edge) if you are using a 10-spoke Super Pulley and want to measure rotational or linear motion based on the outside diameter of the pulley wheel. For example, rolling the pulley along a table top.
To collect data in Gate Timing mode This example uses a single photogate connected to a CBL 2. During the experiment, a regular #2 pencil will be passed through the photogate. Gate Timing can be used with one or two photogates. 1. From the EasyData main screen, select then select Gate Timing.... , and The Flag Width screen is displayed. Press and type in the width of the object that will be passing to return to the main through the photogate. Select screen. 2. to begin collecting data.
4. Select to view the corresponding velocity graph. 5. Select to return to the main screen. Options: When collecting data in Gate Timing mode, it is possible to use one or two photogates. The example above describes the use of a single photogate.
To collect data in Pulse Timing mode This example uses two photogates connected to a LabPro. The gates are spaced 0.5 meters apart along a ramp. During the experiment, a cart will be passed through the two photogates. 1. From the EasyData main screen, select then select Pulse Timing.... , and The Gate Distance is displayed. Press and type to in the distance between the photogates. Select return to the main screen. 2. Select to begin collecting data.
4. Select to view the corresponding velocity graph. 5. Select to return to the main screen. Options: When collecting data in Pulse Timing mode, it is possible to use one or two photogates. The example above describes the use of a two photogates. When performed with a single photogate, time is measured between two consecutive blocks of the gate.
To collect data in Pendulum Timing mode This example uses a single photogate connected to a LabPro. During the experiment, a pendulum bob repeatedly passes through the photogate. 1. From the EasyData main screen, select then select Pendulum Timing.... , and 2. Select to begin collecting data. Wait for the datacollection device to beep, then release the pendulum so that the bob passes through the photogate.
Miscellaneous Data Collection Titration mode cannot be selected and will only appear if a Drop Counter along with an analog sensor is being used. When this mode is set all data-collection settings are preset and cannot be changed. When the titration mode is started, the LabPro or CBL 2 is instructed to collect 2500 samples from the attached sensor at a sample interval of 1 sample/second. It is best to set the drop rate of the titrant no faster than 1 drop/second.
Graph Features and Data-Analysis Tools After collecting data, EasyData displays a graph of the data, automatically scaled for easy viewing. The calculator is placed in Trace mode automatically so you can scroll through the collected data points on the graph screen using the and keys. Several common, data analysis tools are accessible from the graph screen. Graph Screen Overview • The x-axis (horizontal axis) is the independent variable.
The EasyData application has many analysis tools with which to analyze data. Refer to the Analyzing Data section for more information. The Main button is used to exit the graph screen and return to the main screen.
Performing Statistics or Integral calculations Statistics and Integral calculations can be performed over any region of the data shown on a graph. Statistics and Integral calculations are only allowed on a graph that is displaying a and menus single dependent variable on the Y-axis. Use the choices from the to display a graph with only a single dependent variable on the Y-axis. , and 1. From the EasyData graph screen, select then choose Statistics. 2.
Curve Fits There are four types of curve fits available in the menu found on the EasyData graph screen. Each curve fit is unique and designed for a specific use. When a curve fit is selected, it will be performed on all of the displayed data. To fit a curve to a specific region of data, use the Select Region option to isolate only the data you wish to work with. Curve fits can only be applied to a single data set at a time.
3. EasyData displays the curve fit drawn over the original data points. Scroll through the collected data points on and keys. the graph screen using the or To move the trace cursor to the curve fit, press The cursor can now be moved along the curve fit. 40 .
Select Region The Select Region feature is used to isolate a specific and continuous region of a data set. Data outside of the selected region is permanently deleted. The selected region is copied from the calculator’s data lists, all list are cleared of data, and then the selected data is copied back into the lists. Once this feature is used, the data outside your selection is menu before permanently deleted. It may be wise to use the Save As option from the performing a Select Region. 1.
Managing Data: Saving, Opening and Deleting Experiments Using EasyData it is possible to save your experimental setup along with any collected data, for later use. When an experiment is saved it includes the current sensor calibrations, data-collection parameters, and any data that had been collected. Saved experiments are easy to open and help to save time when repeating experiments. Calculator memory does have limitations and it is advisable to routinely delete unnecessary experiment files.
Opening an Experiment 1. Select , and then select Open…. 2. The Open Experiment screen is displayed. Select the . experiment to be opened and then select 3. The experiment is opened and you are returned to the main screen. Deleting an Experiment 1. Select , and then select Delete…. 2. The Delete Experiment screen is displayed. Select the . experiment to be deleted and then select 3. A message appears asking if you are sure you want to to delete the delete the experiment.
Editing a Sensor’s Calibration When EasyData detects a sensor, it automatically loads a calibration for that sensor. If you wish to edit a sensor’s calibration, you can do so by manually entering new calibration values or by using either a single-point or two-point calibration procedure. Manually Inputting a New Calibration 44 1. From the EasyData main screen, select , and then select CH1: (or the appropriate channel). 2. Select 3. .
6. The intercept for the current calibration is displayed. to erase the displayed value. Type in your Press . new intercept value and select 7. from the Sensor Calibration screen. Select Select again to return to the main screen.
Creating a New Calibration using Two Points 46 1. From the EasyData main screen, select Setup, and then select CH1: (or the appropriate channel). 2. Select 3. . A menu is displayed showing the different Select calibration methods. 4. Select Two Point Live…. 5. Place your sensor into the necessary condition for the first calibration point (e.g. a force sensor with no mass hanging from it or a pH sensor in a pH buffer). Monitor the displayed Potential (V). When the value is stable, . select 6.
8. Enter the known value for the second calibration condition (e.g. 1.96 N for a 200 g mass), and select . 9. The Sensor Calibration screen will be displayed with your new calibration slope and intercept values. Select to return to the Sensor Setup screen, and then again to return the main screen.
Creating a New Calibration using a Single Point This calibration method defines a new y-intercept, leaving the existing slope unchanged. Adjusting a barometer to match the local barometric pressure is a good example of using the Single Point calibration. The example below is using a force sensor connected to a LabPro. 48 1. From the EasyData main screen, select Setup, and then select CH1: (or the appropriate channel). 2. Select 3. .
7. The Sensor Calibration screen will be displayed with your new calibration slope and intercept values. Select to return to the Sensor Setup screen, and then again to return to the main screen.
Manually Setting up a Sensor When using a non Auto-ID sensor, it is necessary to set up the sensor manually before data can be collected. The procedure for setting up a sensor is slightly different depending on the type of connector found on the sensor. Analog sensors (most sensors) connect to one of the analog ports found on the left side of the LabPro or CBL 2, or to the EasyLink. Digital sensors (photogates and drop counters) connect to the digital ports found on the right side of the LabPro or CBL 2.
4. Press to clear the long sensor name. Type in . the name of the custom sensor, then select to clear the short sensor name. Type in Press . the short name of the custom sensor, then select to clear the sensor unit. Type in the unit of Press measurement for the custom sensor, then select 5. If the sensor requires a special warm-up period, press to clear the old warm-up time and type in the . Note: if you are unsure new value, then select about a warm-up time, enter a value of 1. 6.
8. From the Conversion Equation screen, choose the type of calibration equation to be used and then select . Note: most sensors use a linear calibration equation. 9. The Sensor Setup screen is displayed with updated information pertaining to the custom sensor. Select to return to the main screen. Digital Sensors 1. From the EasyData main screen, select then select Other Sensors.... , and 2. The Select Channel screen is displayed. Choose DIG/SONIC, and then select . 3.
Data Collection Triggering In most cases, data collection is initiated by selecting . Another option is to set up triggering. There are two methods of triggering available, (1) software trigger and (2) manual trigger. Triggering can only be set when collecting data with a LabPro, CBL 2, CBR, or CBR 2. The EasyLink and EasyTemp do not support triggering. Software Triggering In software triggering, you choose a measurement reading that will trigger data collection, e.g.
4. The Measurement screen is displayed. Choose whether triggering should occur when the readings increase or . decrease (Increasing or Decreasing), and select 5. The Trigger Threshold screen is displayed. Press to clear the old threshold and type in the new . Note: trigger threshold is the value, then select sensor reading, e.g. 28 for 28°C, that will trigger data collection. 6. The Trigger Prestore screen is displayed. Press to clear the old prestore and type in the new value, then .
Manual Triggering In manual triggering, data collection starts when the Start/Stop or Trigger button on the data-collection device (LabPro, CBL 2, CBR, or CBR 2) is pressed. Follow these steps to set up for manual trigger. , and 1. From the EasyData main screen, select then select Time Graph... 2. The current Time Graph settings are displayed. Select . 3. The Select Trigger Type screen is displayed. Choose . Manual and select 4. The updated Time Graph Settings are displayed.
Appendix A: Frequently Asked Questions (EasyData FAQs) Q: May I disconnect a data collection device during data collection safely? A: No, disconnecting a data collection device such as CBR 2™ sonic motion detector, CBL 2™ system, or Vernier EasyTemp™ will result in loss of collected data using EasyData App. Q: What is the recommended amount of calculator RAM memory for use with the EasyData App.
Q: Why will Photogate Auto-ID with LabPro and not with CBL 2? A: The firmware of LabPro will allow this to occur and the firmware for CBL 2 will not. With CBL 2, you may set up the photogate sensor in the Other Sensors menu. Q: I am trying to use TI Connect for Mac® to view my calculator directory while I am connected to a sensor and in EasyData App, why am I not able to view the calculator directory? A: The calculator can only communicate with one device at a time.
Q: Why can’t I calibrate my sensor? A: Not all sensors can be calibrated using the same calibration routine. The available calibration modes are determined by the detected sensor. Q: Why does my calculator use up batteries so quickly? A: The calculator is using battery power any time it is turned on. An application such as EasyData puts an added load on the batteries when it communicates with a connected datacollection device.
Appendix B: Error Messages The table below has been included to provide a helpful explanation of the error messages that may be encountered while using EasyData. Message Description The calculator batteries are too low to safely run EasyData. Select to return to the home screen. Replace the batteries before starting the EasyData app again. The application failed in attempting to communicate with the connected data-collection device.
Message Description The application encountered an error while performing the requested calculation. Some common reasons for this error: A Power curve fit was performed, but not all x and y values are greater than zero. An Exponential curve fit was performed, but not all y values are greater than zero. A two-point calibration was performed, but the reference entered or measured voltage was invalid. Perform the calibration again, making sure the reference and voltage values are distinct.
Message Description EasyData cannot perform the selected operation unless a sensor is set up. and either connect an Auto-ID sensor or Select select and choose Other Sensors to set up a sensor manually. EasyData cannot perform the selected operation unless a data-collection device is connected. Select and perform one of the following: Connect a data-collection device. Select choose New. and to exit EasyData. Connect a dataSelect collection device and then restart EasyData.
Message Description The requested analysis feature requires more data points than are available in the plotted lists. Quadratic curve fits require a minimum of 3 data points. All other analysis features require a minimum of 2 data points. and collect more data points before Select repeating analysis. There are 50 experiments already saved on the calculator. . From the main screen, select and Select choose Delete... Select old experiments to delete before attempting to save an experiment again.
Message Description The minimum calculator OS that will support EasyData is TI-84 Plus OS 2.30 or TI-83 Plus OS 1.16. For the latest calculator OS updates, visit education.ti.com. The calculator or CBR 2 batteries are too low to continue. All data collected has been preserved. , then select from the main screen. Select Replace the batteries in your data-collection device and then restart EasyData.
Appendix C: Warning Messages The table below explains the purpose and meaning of messages that may be encountered while using EasyData. Message Description A new Auto-ID sensor has been detected. to delete all setup information, data, and Select scan for new sensors. to add the detected sensor while Select preserving all existing data and setup information. The application has stored all collected data in the calculator lists shown. Select Selecting screen. to exit EasyData.
Message Description The sample interval or # of samples entered is not supported by the current hardware/software combination. The closest, acceptable value has been substituted. Either the connected data collection device or calculator is running low on batteries. It is recommended that the batteries be replaced. to ignore this warning and continue. A Select loss of data may result. to exit EasyData. Replace the batteries Select before restarting EasyData.
Message Description The experiment name entered already is in use. Select and enter a different experiment name. to overwrite the existing experiment with Select the new file. Select Select to return to the main screen. to permanently delete the experiment file. to preserve the selected experiment and Select return to the main screen. An experiment file was found in the calculator RAM. This may be the result of limited archive memory.