
Manual


10 EasyData Guidebook
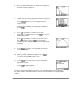
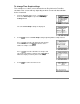
6. Once the motion data has been transferred, a graph of
the ball’s motion is displayed.
7. Identify a bounce on the graph with a uniform shape to it.
Select
and choose Select Region from the
analyze menu.
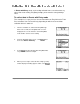
A Region Select warning message will be displayed.
Select
.
8. Press
repeatedly to scroll the cursor to the
beginning of a uniform bounce. Select
to set your
left boundary marker.
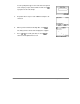
Press
repeatedly to scroll the cursor to the end of
the uniform bounce. Select
to set your right
boundary marker. A graph of the selected region will be
displayed.
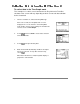
9. Select
to view the corresponding velocity and
acceleration graphs.
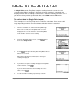
10. When you finish exploring the graphs, select
to return to the EasyData main screen.
11. Select
. A message notes the lists in which the
data can be found.
Select
to quit EasyData.
You have completed the Quick Start exercise for collecting motion. The remainder of
this guide contains detailed instructions and reference information for using EasyData
features.