
User`s guide


AutoTune™ for VX-P820/P920 Rev. C
8
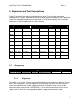
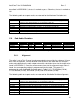
The following radio test report results are returned for the Frequency alignment:
Name Description
Result Pass or Fail. This indicates whether the alignment succeeded in bringing the radio
parameter into alignment limits as specified in the limits file.
Frequency Band center frequency for the radio under test.
Max Limit Maximum passable frequency error, inclusive, as specified in the limits file.
Freq Error Measured frequency error after alignment
Min Limit Minimum passable frequency error, inclusive, as specified in the limits file.
Old Softpot Radio parameter softpot value before alignment.
New Softpot Radio parameter softpot value after alignment.
Table 5-3. Frequency Alignment Results
5.1.2. Test
The radio is set to Test Channel 6 and commanded to transmit by the software. The
analyzer then samples the radio’s frequency error. If the sampled frequency error falls
within the Frequency test limit range described in APPENDIX C, the test is marked as
pass. Otherwise, the test is marked as fail.
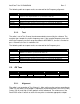
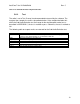
The following radio test report results are returned for the Frequency test:
Name Description
Result Pass or Fail. This indicates whether the radio’s sampled Frequency error fell
within the test limits as specified in the limits file.
Frequency Band center frequency for the radio under test.
Max Limit Maximum passable frequency error, inclusive, as specified in the limits file.
Freq Error Measured frequency error after alignment
Min Limit Minimum passable frequency error, inclusive, as specified in the limits file.
Softpot Current radio parameter softpot value.
Table 5-4. Frequency Test Results
5.2. RX Tune
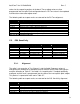
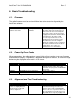
Monitor Mode RF Control Port Frequency Modulation Output Level
Standard Generate RF I/O Test Channel 01 1 kHz @ 3 kHz dev. -103 dBm
Standard Generate RF I/O Test Channel 02 1 kHz @ 3 kHz dev. -103 dBm
Standard Generate RF I/O Test Channel 03 1 kHz @ 3 kHz dev. -103 dBm
Table 5-5. Analyzer Configuration for RX Tune Alignment
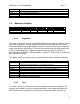
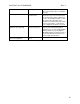
5.2.1. Alignment
The radio is set to receive at Test Channel 1. After setting up the analyzer according to
Table 5-5, the radio’s RSSI softpot is sequentially incremented across the Low (CH 02),
Center (CH 01) and High (CH 03) portions of the radio band. The software uses the
Peak RSSI values it locates at each of these points to calculate appropriate softpot