
Specifications
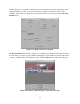

38
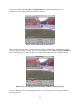
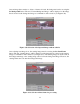
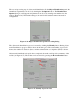
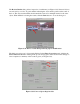
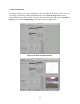
The tracked object can be inspected one frame at a time by sliding the Frame toolbar (see Figure
6.44). The Object Display panel and Graph Display panel will automatically update. The
Object Display panel shows the position of the tracked object using a red box. The Graph
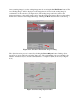
Display panel plots all of the object data as a blue curve. A red dot is also plotted corresponding
to the observed value for the particular frame visualized in the Object Display panel. The
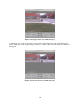
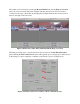
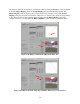
visualized object is set using either the Object Number toolbar or textbox (see Figure 6.45).
Figure 6.44. Object examination using frame slider bar
Figure 6.45. Object selection using object number slider bar or text entry box