DSO-1062D/DSO-1102D/DSO-1202D different bandwidths Digital Oscilloscope User Manual
Contents Contents Contents ........................................................................................................................................... i Copyright Declaration ................................................................................................................... iv Chapter 1 Safety Tips .................................................................................................................... 1 1.1 1.2 1.3 1.4 1.5 General Safety Summary ................
Contents 5.3 Vertical Controls ............................................................................................................... 19 5.3.1 Math FFT .................................................................................................................. 21 5.3.1.1 Setting Time-domain Waveform............................................................................ 21 5.3.1.2 Displaying FFT Spectrum.....................................................................................
Contents 10.1 10.2 General Care ................................................................................................................... 68 Cleaning ........................................................................................................................... 68 Appendix A Harmful and Poisonous Substances or Elements ............................................... 69 Appendix B Index ..................................................................................................
Copyright Declaration Copyright Declaration All rights reserved; no part of this document may be reproduced or transmitted in any form or by any means, electronic or mechanical, without prior written permission from our company. Our company reserves all rights to modify this document without prior notice. Please contact our company for the latest version of this document before placing an order.
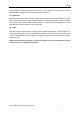
Safety Tips Chapter 1 Safety Tips 1.1 General Safety Summary Read the following safety precautions to avoid injury and prevent damage to this product or any products connected to it. To evade potential hazards, use this product only as specified. Only qualified personnel should perform maintenance. Avoid fire or personal injury. Use suitable power cord. Use only the power cord specified for this product and certified for the country of use. Connect and disconnect properly.
Safety Tips 1.2 Safety Terms and Symbols The following terms may appear in this manual: WARNING. Warning statements point out conditions or practices that could result in injury or loss of life. CAUTION. Caution statements identify conditions or practices that could result in damage to this product or other property. 1.3 Terms on Product The following terms may appear on the product: DANGER indicates an injury hazard immediately accessible as you read the marking.
Overview Chapter 2 Overview 2.1 Brief Introduction to DSO-1000D Model DSO-1062D DSO-1102D DSO-1202D Channels 2 2 2 Bandwidth Sample Rate 60MHz 1GSa/s 100MHz 1GSa/s 200MHz 1GSa/s Table 2-1 DSO-1000D main specification LCD 7 inch color 7 inch color 7 inch color DSO-1000D oscilloscope is with the bandwidth of 60MHz/100MHz/200MHz, and provides the real-time and equivalent sample rates respectively up to 1GSa/s and 25GSa/s.
Overview knob indicate the alternative function of the knob. If a topic uses more than one page, turn the HELP SCROLL knob to move from page to page within the topic. Hyperlinks Most of the help topics contain phrases marked with angle brackets, such as . They are links to other topics. Turn the HELP SCROLL knob to move the highlight from one link to another. Push the Show Topic option button to display the topic corresponding to the highlighted link.
Getting Started Guide Chapter 3 Getting Started Guide 3.1 Installation To keep proper ventilation of the oscilloscope in operation, leave a space of more than 5cm away from the top and the two sides of the product. 3.1.1Power Supply Use a power supply that delivers 90 to 240 VRMS, 45 to 440 Hz. 3.1.2Power Cord Use only power cords designed for this product. Refer to 8.2 Accessories for specific standards. 3.
Getting Started Guide CH1: to connect with the probe PROBE COMP 3.2.3Observe the waveform Press the AUTOSET button and you should see within a few seconds a square wave of about 5V peak-to-peak at 1kHz in the display. Press the CH1 MENU button twice to remove Channel 1. Push the CH2 MENU button and repeat Step 2 and Step 3 to observe Channel 2. 3.3 Probe Examination 3.3.1Safety When using the probe, keep your fingers behind the guard on the probe body to avoid electric shock.
Getting Started Guide 3.3.2Use of Probe Check Wizard Every time you connect a probe to an input channel, you should use the probe check wizard to verify that this probe is operating correctly. There are two ways to do this: 1) Use the vertical menu (for example, push the CH1 MENU button) to set the Probe option attenuation factor. 2) Press the PROBE CHECK button to use the Probe Check Wizard and configure the probe option attenuation factor properly following menu prompts. 3.
Getting Started Guide 3.5 Probe Attenuation Setting Probes are of various attenuation factors which affect the vertical scale of the signal. The Probe Check function is used to verify if the Probe attenuation option matches the attenuation of the probe. As an alternative method to Probe Check, you can push a vertical menu button (such as the CH 1 MENU button) and select the Probe option that matches the attenuation factor of your probe.
Main Feature Description Chapter 4 Main Feature Description This chapter provides some general information that you need to learn before using an oscilloscope. It contains: 1. Oscilloscope setup 2. Trigger 3. Data acquisition 4. Waveform scaling and positioning 5. Waveform measurement 4.1 Oscilloscope Setup While operating the oscilloscope, you may often use three features: Autoset, saving a setup and recalling a setup. Hereinafter they are introduced one by one.
Main Feature Description trigger channel or the AC power line (only for Edge triggers). The source with the AC power line shows the frequency relationship between the signal and the AC commercial power. Trigger Type: The oscilloscope has six types of triggers: Edge, Video, Pulse Width, Slope, Overtime and Swap. Edge Trigger uses the analog or digital test circuits for triggering. It happens when the input trigger source crosses a specified level in a specified direction.
Main Feature Description 4.3 Data Acquisition When you acquire an analog signal, the oscilloscope will convert it into a digital one. There are two kinds of acquisition: Real-time acquisition and Equivalent acquisition. The real-time acquisition has three modes: Normal, Peak Detect, and Average. The acquisition rate is affected by the setting of time base. Normal: In this acquisition mode, the oscilloscope samples the signal in evenly spaced intervals to establish the waveform.
Main Feature Description You can adjust the HORIZONTAL POSITION control to view waveform data before the trigger, after the trigger, or some of each. When you change the horizontal position of a waveform, you are actually changing the time between the trigger position and the screen center. For example, if you want to find out the cause of a glitch in your test circuit, you should trigger on the glitch and make the pretrigger period long enough to capture data before the glitch.
Main Feature Description Cursor Cursor Automatic Measurement: The oscilloscope performs all the calculations automatically in this mode. As this measurement uses the waveform record points, it is more precise than the graticule and cursor measurements.
Basic Operation Chapter 5 Basic Operation The front panel of the oscilloscope is divided into several functional areas. In this chapter we will give a quick overview of all control buttons and knobs on the front panel as well as the displayed information on the screen and relative testing operations. The figure below illustrates the front panel of the DSO-1000D digital oscilloscope. Front Panel of DSO-1000D 5.
Basic Operation 1. Display Format: : YT : XY : Vectors : Dots : Gray indicates auto persistence; Green means persistence display is enabled. When the icon is set to green, the time for persistence display will be shown behind it. 2. Acquisition Mode: Normal, Peak Detect or Average 3. Trigger Status: The oscilloscope is acquiring pretriggered data. All pretriggered data have been acquired and the oscilloscope is ready to accept a trigger.
Basic Operation : Pulse Width trigger, positive polarity. : Pulse Width trigger, negative polarity. 13. 14. 15. 16. Pop-up Prompt Readout tells trigger level. Icon indicates whether the waveform is inverted or not. 20M Bandwidth Limit. If this icon lights up, it means the bandwidth limit is enabled, otherwise disabled. 17. Icon indicates channel coupling. 18. Channel Marker 19. Window displays waveform. 5.1.
Basic Operation 1. HORIZONTAL POSITION Knob: Used to control the trigger position against the screen center. Push this button to reset the trigger point back to the screen center. AN: Used to set the horizontal position as zero. 2. Each option in HORIZ MENU is described as follows. Options Settings Comments Window Control Major Window Minor Window Selects the major or minor window in dual-window mode. The window is highlighted once selected.
Basic Operation Dual-window Mode (Full Screen) Location of expanded window data in memory Major Window Minor Window (Expanded Window) Multi-functional Knob 3.SEC/DIV Knob: Used to change the horizontal time scale so as to magnify or compress the waveform horizontally. If the waveform acquisition is stopped (by using the RUN/STOP or SINGLE SEQ button), the SEC/DIV control will expand or compress the waveform. In dual-window mode, push this knob to select major or minor window.
Basic Operation 1. For more information of the trigger holdoff, see Section Trigger Controls. 2. In single-window mode, press F0 to hide or show the menus on the right side. The dual-window mode does not support the menu hiding function. 5.2.1Scan Mode Display (Roll Mode) With the SEC/DIV control set to 80ms/div or slower and the trigger mode set to Auto, the oscilloscope works in the scan acquisition mode.
Basic Operation 20MHz Bandwidth Limit Unlimited Limited VOLTS/DIV Coarse Fine 1X 10X 100X 1000X Off On Probe Attenuation Invert Limits the bandwidth to reduce display noise; filters the signal to eliminate noise and other unnecessary HF components. Selects the resolution of the VOLTS/DIV knob. Coarse defines a 1-2-5 sequence. Fine changes the resolution to small steps between the Coarse settings. Selects a value according to the probe attenuation factor so as to ensure correct vertical readouts.
Basic Operation 5.3.1Math FFT This chapter elaborates how to use the Math FFT (Fast Fourier Transform). You can use the Math FFT mode to convert a time-domain (YT) signal into its frequency components (spectrum), and to observe the following types of signals: Analyze harmonics in power cords; Measure harmonic content and distortion in systems; Characterize noise in DC power supplies; Test impulse response of filters and systems; Analyze vibration.
Basic Operation 2. Set the Operation option to FFT; 3. Select the Math FFT Source channel. In many situations, the oscilloscope can also generate a useful FFT spectrum despite the YT waveform not being triggered. This is especially true if the signal is periodic or random (such as noise). Note: You should trigger and position transient or burst waveforms as close as possible to the screen center.
Basic Operation 1 Fundamental frequency component Frequency component 5 2 3 4 1. Frequency at the center graticule line 2. Vertical scale in dB per division (0dB=1VRMS) 3. Horizontal scale in frequency per division 4. Sample rate in number of samples per second 5. FFT window type 5.3.1.3 Selecting FFT Window Using windows can eliminate the spectral leakage in the FFT spectrum. The FFT algorithm assumes that the YT waveform repeats all the time. When the number of cycles is integral (1, 2, 3 ...
Basic Operation Applying a window to the YT waveform changes the waveform so that the start and stop values are close to each other, which reduces the discontinuities. The Math FFT function has three FFT Window options. There is a trade-off between frequency resolution and amplitude accuracy for each type of window. You shall determine which one to choose according to the object you want to measure and the source signal characteristics.
Basic Operation 5.3.1.4 FFT Aliasing Problems occur when the time-domain waveform acquired by the oscilloscope contains frequency components higher than the Nyquist frequency. The frequency components above the Nyquist frequency will be undersampled and displayed as lower frequency components that ‘fold back’ from the Nyquist frequency. These erroneous components are called aliases. 5.3.1.5 Eliminating Aliases To eliminate aliases, use the following methods.
Basic Operation the marker M (math waveform reference point on the left edge of the screen). Turn the VERTICAL POSITION knob clockwise to move up the spectrum. 5.3.1.7 Using Cursors to Measure FFT Spectrum You may use cursors to take two measurements on the FFT spectrum: amplitude (in dB) and frequency (in Hz). Amplitude is referenced to 0db that equals 1VRMS here. You may use cursors to measure at any zoom factor. Push the CURSOR button, choose the Source option and then select Math.
Basic Operation 1. Level It sets the amplitude level the signal must cross to cause an acquisition when using the Edge or Pulse Width trigger. 2. Set to 50% The trigger level is set to the vertical midpoint between the peaks of the trigger signal. 3. Force Trigger Used to complete an acquisition regardless of an adequate trigger signal. This button becomes useless if the acquisition is already stopped. 4. TRIG MENU Push this button to display trigger menus. The edge trigger is in common use.
Basic Operation Options Trigger Type Edge Video Pulse Slope Swap Overtime Settings Source CH1 CH2 EXT EXT/5 AC Line Mode Auto Normal Coupling AC DC HF Reject LF Reject Comments By default the oscilloscope uses the edge trigger which triggers the oscilloscope on the rising or falling edge of the input signal when it crosses the trigger level (threshold). Select the input source as the trigger signal. CH1, CH2: No matter the waveform is displayed or not, a certain channel will be triggered.
Basic Operation Note: When you choose Normal Polarity, the trigger always occurs on negative-going sync pulses. If the video signal contains positive-going sync pulses, use the Inverted Polarity option. Pulse Width Trigger You can use it to trigger on aberrant pulses. Options Settings Comments With Pulse highlighted, the trigger occurs on pulses that meet the trigger condition (defined by the Source, When and Set Pulse Width options).
Basic Operation or not equal to the specified pulse width. <, >: Triggers the oscilloscope when the source signal pulse width is less than or greater than the specified pulse width. Slope Trigger: Judges trigger according to the time for rising or falling, more flexible and accurate than the Edge trigger. Options Settings Comments Slope Source CH1 CH2 EXT EXT5 Select the input source as the trigger signal. Slope Rising Falling Select the slope type of signal.
Basic Operation Type Edge Slope Rising Falling Coupling AC DC HF Reject LF Reject Type Polarity Standard Sync Type Polarity When Push F3 or F4 to select the components of the trigger signal applied to the trigger circuitry. Video Normal Inverted NTSC PAL/SECAM All Lines Line Number Odd Field Even Field All Fields Pulse Positive Negative = ≠ < > Select by F4, F5. Select by F3. Set Pulse Width Pulse Width Push F4 to select. Adjust the multi-functional knob V0 to set the pulse width.
Basic Operation ≠ < > Time 20ns to 10.0sec Press F4 to select this option. Turn the multi-functional knob to set the time span. Overtime Trigger: In Pulse Width trigger, you may sometimes be puzzled with the long time for trigger, as you do not need a complete pulse width to trigger the oscilloscope, but want the trigger occurs just upon the overtime point. This is called Overtime Trigger.
Basic Operation setup menus. SAVE/RECALL: Displays the Save/Recall menu for setups and waveforms. MEASURE: Displays the Measure menu. ACQUIRE: Displays the Acquire menu. UTIILITY: Displays the Utility menu. CURSOR: Displays the Cursor menu. DISPLAY: Displays the Display menu. 5.5.1SAVE/RECALL Press the SAVE/RECALL button to save or recall oscilloscope setups or waveforms. The first page shows the following menu.
Basic Operation to a known setup. See below for waveform menus. The white waveforms on the menu is the recalled RefA waveform At most 9 groups of setups can be stored Note: The oscilloscope will save the current settings if you wait 5 seconds after the last modification, and it will recall these settings the next time you power on the oscilloscope. 5.5.2MEASURE Push the MEASURE button to perform auto measurements. There are 11 types of measurements and up to 8 can be displayed at a time.
Basic Operation The readouts in big font size on the menu are just results of the corresponding measurements. Taking Measurements: For a single waveform (or a waveform divided among multiple waveforms), up to 8 automatic measurements can be displayed at a time. The waveform channel must stay in an ‘ON’ (displayed) state to facilitate the measurement. The automatic measurement can not be performed on reference or math waveforms, or in XY or Scan mode. 5.5.
Basic Operation default). Normal Acquisition Intervals 1 2 3 4 5 6 7 8 9 10 Sample Points Normal Mode Acquires a Single Sample Point in Each Interval Peak Detect: Use this mode to detect glitches within 10ns and to limit the possibility of aliasing. This mode is valid at the SEC/DIV setting of 4µs/div or slower. Once you set the SEC/DIV setting to 4µs/div or faster, the acquisition mode will change to Normal because the sample rate is fast enough that Peak Detect is unnecessary.
Basic Operation 5.5.4UTILITY Push the UTILITY button to display the Utility Menu as follows. Options Comments System Info Display the software and hardware versions, serial number and some other information about the oscilloscope. Update Program Insert a USB disk with upgrade program and the disk icon at the top left corner is highlighted. Press the Update Program button and the Software Upgrade dialog pops up. Push F6 to upgrade or push F2 to cancel.
Basic Operation behind the cursor displays the location of the cursor. Delta Display the difference (delta) between the cursors. Display the measurement in the box under this option. Moving Cursors: Press the key near Select Cursor to select a cursor and turn V0 to move it. Cursors can be moved only when the Cursor Menu is displayed. Voltage Cursor Time Cursor 5.5.6DISPLAY The waveform display is affected by settings of the oscilloscope. A waveform can be measured once it is captured.
Basic Operation Next Page Grid Dotted line Real line OFF Off only displays the horizontal and vertical coordinates at the center graticule on the screen. 0-15 16 ranks adjustable, with a progress bar to display. Grid Intensity 5.6 Fast Action Buttons AUTOSET: Automatically set the oscilloscope controls to generate a usable display of the input signals. Refer to the following table for relative content. SINGLE SEQ: Acquire a single waveform and then stop the acquisition.
Basic Operation Trigger Video Standard Vertical Bandwidth Adjusted Full DC (if GND was chosen before); AC for the video signal; otherwise, Vertical Coupling unchanged VOLTS/DIV Adjusted The Autoset function examines all channels for signals and displays corresponding waveforms. Autoset determines the trigger source according to the following conditions. If multiply channels get signals, the oscilloscope will use the channel with the lowest frequency signal as the trigger source.
Basic Operation 5.6.3Default Setup When you push the DEFAULT SETUP button, the oscilloscope will display the CH1 waveform and remove all the others. When you are at the default setup, press F1 to Undo Preset. Then the oscilloscope returns to the status before default setup. The table below gives the options, buttons and controls that change settings at default setup.
Basic Operation Trigger (Slope) Coupling DC Slope Rising Mode Auto Coupling DC When = CH1 Trigger (Swap) Trigger (OT) Vertical System, All Channels Type Edge Slope Rising Mode Auto Coupling DC Level 0.00v CH2 Type Edge Slope Rising Mode Auto Coupling DC Level 0.00v Source CH1 Polarity Positive Mode Auto Time Coupling Bandwidth Limit 20ns DC Unlimited VOLTS/DIV Coarse Probe Voltage Voltage Probe Attenuation 10X Invert Off Position 0.00div (0.
Basic Operation 5.7 Multi-functional Knobs and Buttons V0: Multi-functional knob. Under different menu options, it supports selecting menu options (MEASURE), moving cursors and levels (Slope Trigger). Press this knob to reset data (trigger holdoff, overtime of the overtime trigger and slope trigger), select menu options and so on. Easy to operate. F7: Push this button to switch between single-window mode and dual-window mode. F0: Hide/Show button.
Basic Operation shields connect to earth ground and are considered to be ground terminals. To avoid damages, do not connect a voltage source to any of these ground terminals.
Application Examples Chapter 6 Application Examples This chapter unfolds a further description on main features of the oscilloscope by giving eleven simplified application examples for reference to help solve your own test problems. 1. Taking simple measurements Using AUTOSET Using the Measure menu to take auto measurements 2. Taking cursor measurements Measuring ring frequency and ring amplitude Measuring pulse width Measuring rise time 3.
Application Examples Taking Auto Measurements The oscilloscope can display most signals by automatic measurements. To measure such parameters as the signal frequency, period, peak-to-peak amplitude, rise time and positive width, follow the steps below. 1. Push the MEASURE button to see the Measure menu. 2. Turn the knob V0 to select the first ‘unspecified’ option (marked by red arrow), press V0 or F6 to enter the submenu. 3. Select CH1 for the Source option.
Application Examples 6.2 Example 2: Taking Cursor Measurements You can use the cursor to quickly measure the time and amplitude of a waveform. Measuring Ring Time (convertible to Frequency) and Amplitude on Rising Edge of Pulse To measure the ring time on the rising edge of the pulse, follow the steps below. 1. Push the CURSOR button to view the Cursor menu. 2. Push F1 the Type option button and select Time. 3. Push F2 or F3 the Source option button and select CH1. 4. Push F4 to select a cursor.
Application Examples Measuring Pulse Width To analyze a pulse signal and to know its width, follow the steps below. 1. Push the CURSOR button to view the Cursor menu. 2. Push F1 the Type option button and select Time. 3. Push F2 or F3 the Source option button and select CH1. 4. Push F4 to select a cursor. If S is selected, turn V0 to move Cursor S on the screen; if E is selected, turn V0 to move Cursor E; if both are selected, turn V0 to move them at the same time. 5.
Application Examples Measuring Rise Time of Pulse You may need to measure the rise time of the pulse in many application environments, usually, to measure the rise time between the 10% and 90% levels of the pulse waveform. To do so, follow the steps below. 1. Turn the SEC/DIV knob to display the rising edge of the waveform. 2. Turn the VOLTS/DIV and VERTICAL POSITION knobs to adjust the waveform amplitude to about 5 divisions. 3. Push the CH1 MENU button. 4.
Application Examples 5 divisions 6.3 Example 3: Analyzing Input Signals to Eliminate Random Noise In certain circumstances, to display a noisy signal on the oscilloscope and to get its details, you may follow the steps below to analyze this signal. Observing Noisy Signal 1. Press the ACQUIRE button to see the Acquire menu. 2. Push the Type option button and select Real Time. 3. Push the Peak Detect option button. 4.
Application Examples Eliminating Random Noise 1. Press the ACQUIRE button to see the Acquire menu. 2. Push the Type option button and select Real Time. 3. Push the Average option button. 4. Push the Averages option button and adjust the number of running averages to watch the change in the waveform display. Note: Averaging reduces random noise and let you view the signal details more easily. See the figure below for better understanding 6.
Application Examples To set for a single-shot acquisition, follow the steps below. 1. First, set up the oscilloscope probe and the attenuation factor of CH1. 2. Turn the vertical VOLTS/DIV and horizontal SEC/DIV knobs to a proper position for a better examination of the signal. 3. Press the ACQUIRE button to see the Acquire menu. 4. Push the Peak Detect option button. 5. Push the TRIG MENU button and select Rising for the Slope option. Then adjust the trigger level properly. 6.
Application Examples 5. Turn the VOLTS/DIV knobs to display approximately the same amplitude signals on each channel. 6. Push the DISPLAY button to see the Display menu. 7. Push the Format option button and select XY. 8. Now the oscilloscope displays a Lissajous pattern to characterize the input and output of the circuit. 9. Turn the VOLTS/DIV and VERTICAL POSITION knobs to properly scale the waveform display. 10.
Application Examples 1. Set the Probe option attenuation to 10X. 2. Push the AUTOSET button to trigger a stable waveform display. 3. Push the Single Cycle option button in the Autoset menu and read out the signal pulse width. 4. Push the TRIG MENU button. 5. Push F1 to select Pulse for the Type option; push F2 to select CH1 for the Source option; turn the TRIGGER LEVEL knob to set the trigger level at the bottom of the signal. 6. Push F6 to enter the next page.
Application Examples 1. Push the TRIG MENU button to see the Trigger menu. 2. Push F1 to select Video for the Type option. 3. Push the Source option button to select CH1; push the Polarity option button to select Normal; push the Standard option button to select NTSC. 4. Push the Sync option button to select Odd Field, Even Field or All Fields. 5. Turn the Trigger Level knob to adjust the trigger level and stabilize video signals. 6.
Application Examples 6.8 Example 8: Using Slope Trigger to Capture Particular Slope Signal In many occasions, we are not only concerned about the edge of the signal, but also want to know the rise and fall times of the signal. To better observe this kind of signals, we bring in the slope trigger. Follow the steps below. 1. Push the TRIG MENU button to see the Trigger menu. 2. Push F1 to select Slope for the Type option. 3.
Application Examples 6.9 Example 9: Using Overtime Trigger to Measure Long Pulse Signal It is not easy to observe some part of a long pulse signal by using the edge or pulse width trigger. In such case, you can use the overtime trigger by following steps. 1. Push the TRIG MENU button to see the Trigger menu. 2. Push F1 to select OT for the Type option; push the Polarity option button to select Normal; push the Mode option button to select Auto; push the Coupling option button to select DC. 3.
Application Examples Note: The difference between the overtime and the delay triggers is that the overtime trigger can identify the pulse you need according to your set time and trigger on any point of the pulse. In the other word, the overtime trigger occurs based on pulse identification. It is similar to the > mode of the pulse width trigger, but not the same. 6.
Application Examples CH2. Follow the above steps to set up the Math menu, and observe the subtracted waveform as shown in the figure below. Those in pink are added waveforms. 6.11 Example 11: Measuring Data Propagation Delay When you doubt that there appear instabilities in a serial data propagation control circuit, you can set the oscilloscope to measure the propagation delay between the enable signal and the transfer data. To set the propagation delay measurement, follow the steps below. 1.
Application Examples CH1 DATA CH2 CS CS DATA DSO-1000D Digital Oscilloscope User Manual 60
Troubleshooting Chapter 7 Troubleshooting 7.1 Problem Settlement 1. If the oscilloscope does not start up at power on, follow these steps: 1) Check the power cord to verify it has been connected properly; 2) Check the power on/off button to ensure it has been pushed; 3) Then restart the oscilloscope. Contact your local distributor or directly keep touch with our Technical Support department if the oscilloscope still can not be turned on normally. 2.
Specifications Chapter 8 Specifications 8.1 Technical Specifications All specifications herein mentioned apply to the DSO-1062D oscilloscopes. Before checking an oscilloscope from our company to see if it complies with these specifications, make sure it meets the following conditions: The oscilloscope must have been operating continuously for twenty minutes under the specified operating temperature.
Specifications VOLTS/DIV Range 2mV/div to 5V/div at input BNC Position Range 2mV/div to 200mV/div, ±2V >200mV/div to 5V/div, ±50V Analog Bandwidth in Normal and Average modes at BNC or with probe, DC Coupled 2mV/div to 20mV/div, ±400mV 50mV/div to 200mV/div, ±2V 500mV/div to 2V/div, ±40V 5V/div, ±50V Selectable Analog Bandwidth Limit, typical 20MHz Low Frequency Response (-3db) ≤10Hz at BNC Rise Time at BNC, typical <1.7ns(DSO-1202D), <3.5ns(DSO-1102D), <5.
Specifications EXT/5 Trigger Level Range Trigger Level Accuracy, typical (Accuracy is for signals having rise and fall times ≥20ns) Set Level to 50%, typical 1V from DC to 100MHz 1V from DC to 100MHz; 1.75V from 100MHz to 200MHz AC Attenuates signals below 10Hz HF Reject Attenuates signals above 80kHz LF Reject Same as the DC-coupled limits for frequencies above 150kHz; attenuates signals below 150kHz Source Range CH1, CH2 ±8 divisions from center of screen EXT ±1.
Specifications Pulse Width Range Selectable from 20ns to 10s Slope Trigger Slope Trigger Mode Trigger when < (Less than), > (Greater than), = (Equal), or ≠ (Not Equal); Positive slope or Negative slope Slope Trigger Point Equal: The oscilloscope triggers when the waveform slope is equal to the set slope. Not Equal: The oscilloscope triggers when the waveform slope is not equal to the set slope. Less than: The oscilloscope triggers when the waveform slope is less than the set slope.
Specifications simultaneously Average After N acquisitions on all channels simultaneously, N can be set to 4, 8, 16, 32, 64 or 128 Inputs Inputs Input Coupling DC, AC or GND Input Impedance, DC coupled 1MΩ±2% in parallel with 20pF±3pF Probe Attenuation 1X, 10X Supported Probe Attenuation Factors 1X, 10X, 100X, 1000X Maximum Input Voltage Overvoltage Category Maximum Voltage CAT I and CAT II 300VRMS (10×), Installation Category CAT III 150VRMS (1×) Installation Category II: derate at 20dB/d
Specifications Fuse 2A, T rating, 250V Environmental Temperature Cooling Method Humidity Altitude Mechanical Shock Operating: 32℉ to 122℉ (0℃ to 50℃) Nonoperating: -40℉ to 159.8℉ (-40℃ to +71℃) Convection +104℉ or below (+40℃ or below): ≤90% relative humidity 106℉ to 122℉ (+41℃ to 50℃): ≤60% relative humidity Operating and Nonoperating 3,000m (10,000 feet) Random Vibration 0.31gRMS from 50Hz to 500Hz, 10 minutes on each axis Nonoperating 2.
Specifications A USB A-B line, used to connect external devices with USB-B interface like a printer or to establish communications between PC and the oscilloscope. A software installation CD. It contains the user manual of DSO-1062D, giving particular descriptions on the DSO-1062D oscilloscope. 8.3 Open Source Information General Information: Kernel Version Linux2.6.
General Care and Cleaning Chapter 9 General Care and Cleaning 9.1 General Care Do not put or leave the device in a place where the LCD display will be exposed to direct sunlight for long periods of time. Note: To avoid damage to the oscilloscope or probes, do not expose them to sprays, liquids, or solvents. 9.2 Cleaning Examine the oscilloscope and probes as often as operating conditions require.
Harmful and Poisonous Substances or Elements Appendix A Harmful and Poisonous Substances or Elements Harmful and poisonous substances or elements 1 Component2 Pb Hg Cd Cr(Vi) PBB PBDE Shell and Chassis X 0 0 X 0 0 Display Module X X 0 0 0 0 Circuit Board X 0 0 X 0 0 Power Supply X 0 0 X 0 0 Electric Wire and Cable Assembly X 0 0 0 0 0 Connector X 0 0 X 0 0 Fastener and Installed Hardware X 0 X X 0 0 Other Accessories (including probes) X 0 0 X 0
Harmful and Poisonous Substances or Elements Appendix B Index Search by alphabetical order A AC coupling ACQUIRE button Acquisition mode Amplitude cursor Application examples Automatic measurement AUTOSET AUTOSET button Autoset function Average 66 35 11 12 45 12 3 6 3 11 B Bandwidth limit 16 C Capturing single-shot signal CH1 MENU button CH2 MENU button Cleaning Coarse, Fine Connector Contrast Coupling CURSOR CURSOR button Cyc RMS 51 6 6 70 20 5 39 9 12 12 34 D DISPLAY button Dual-window 38 17 E Ed
Harmful and Poisonous Substances or Elements Standard accessories Swap Trigger N Negative pulse NTSC Nyquist frequency 29 28 22 O Option button Overtime Trigger Overview 4 10 3 P PAL Peak Detect Pk-Pk Power cord Power supply Probe Probe attenuation PROBE CHECK button PROBE COMP connector Probe compensation Probe ground lead Pulse width trigger 28 11 34 5 5 1 8 7 5 3 1 10 R Recall Rectangular RUN/STOP button S Sample rate SAVE/RECALL Scale Scan mode display (roll mode) SECAM SEC/DIV knob Self calibra
Harmful and Poisonous Substances or Elements Appendix C GNU GENERAL PUBLIC LICENSE Version 2, June 1991 Copyright (C) 1989, 1991 Free Software Foundation, Inc., 51 Franklin Street, Fifth Floor, Boston, MA 02110-1301 USA Everyone is permitted to copy and distribute verbatim copies of this license document, but changing it is not allowed. Preamble The licenses for most software are designed to take away your freedom to share and change it.
Harmful and Poisonous Substances or Elements passed on, we want its recipients to know that what they have is not the original, so that any problems introduced by others will not reflect on the original authors' reputations. Finally, any free program is threatened constantly by software patents. We wish to avoid the danger that redistributors of a free program will individually obtain patent licenses, in effect making the program proprietary.
Harmful and Poisonous Substances or Elements b) You must cause any work that you distribute or publish, that in whole or in part contains or is derived from the Program or any part thereof, to be licensed as a whole at no charge to all third parties under the terms of this License.
Harmful and Poisonous Substances or Elements received the program in object code or executable form with such an offer, in accord with Subsection b above.) The source code for a work means the preferred form of the work for making modifications to it. For an executable work, complete source code means all the source code for all modules it contains, plus any associated interface definition files, plus the scripts used to control compilation and installation of the executable.
Harmful and Poisonous Substances or Elements If any portion of this section is held invalid or unenforceable under any particular circumstance, the balance of the section is intended to apply and the section as a whole is intended to apply in other circumstances.
Harmful and Poisonous Substances or Elements OTHER PARTIES PROVIDE THE PROGRAM "AS IS" WITHOUT WARRANTY OF ANY KIND, EITHER EXPRESSED OR IMPLIED, INCLUDING, BUT NOT LIMITED TO, THE IMPLIED WARRANTIES OF MERCHANTABILITY AND FITNESS FOR A PARTICULAR PURPOSE. THE ENTIRE RISK AS TO THE QUALITY AND PERFORMANCE OF THE PROGRAM IS WITH YOU. SHOULD THE PROGRAM PROVE DEFECTIVE, YOU ASSUME THE COST OF ALL NECESSARY SERVICING, REPAIR OR CORRECTION. 12.
Harmful and Poisonous Substances or Elements Also add information on how to contact you by electronic and paper mail. If the program is interactive, make it output a short notice like this when it starts in an interactive mode: Gnomovision version 69, Copyright (C) year name of author Gnomovision comes with ABSOLUTELY NO WARRANTY; for details type `show w'. This is free software, and you are welcome to redistribute it under certain conditions; type `show c' for details.