
User's Manual

74
CHAPTer 6 o LANE SETUP
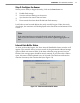
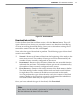
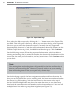
The interval data in the Interval Data Screen is displayed in a table that contains
the lane name, volume, speed, occupancy, and class. The lane at the top of the
table is the lane closest to the sensor. At the boom of the screen is a status bar
that indicates the time the interval data table was last updated. It also displays
the amount of time that has elapsed since this update.
Lane Name –
Displays the string of eight alphanumeric characters that
describes the lane.
Volume –
Shows the number of events during the interval.
Interval Lane Speed –
Represents the average speed of the lane during the
time of the interval. The speed is displayed either in miles per hour (mph)
or kilometers per hour (kph), depending on your seings.
Occupancy –
Displays the percentage of time vehicles occupied the
sensor’s detection zone during the selected interval.
Class –
Represents the percentage of vehicles detected as ing in one of
three length-based classication groupings (Small, Medium, and Large).
Note
To open data logs from anywhere in the Smart Sensor Manager program,
go to File>Data Logs . . . >Open and select the type of log. This will open
the most recently used log.