ecoExplorer go Manual
Foreword Foreword Revision History Version Date Change 0.0 07/2016 First Edition 1.0 09/2016 Chapter 4.1.3.6 correction 2.0 03/2017 Chapter 3.4.13 and 3.5.1 deleted 3.0 02/2018 Page 7, device list extended Contact Address Weidmüller Interface GmbH & Co. KG Klingenbergstraße 16 32758 Detmold Germany Phone +49 (0) 5231 14-0 Fax +49 (0) 5231 14-292083 info@weidmueller.com www.weidmueller.
Contents Contents Foreword.............................................................................................................................. 3 Revision History................................................................................................................... 3 Contact Address.................................................................................................................. 3 Contents.................................................................................
Contents 3.4.1 Jasic start........................................................................................................... 64 3.4.2 Repeater / Single template................................................................................. 65 3.4.3 Comparator template.......................................................................................... 65 3.4.4 Group................................................................................................................. 66 3.4.
Contents 3.5.31 3.5.32 3.5.33 3.5.34 3.5.35 3.5.36 3.5.37 3.5.38 3.5.39 3.5.40 3.5.41 3.5.42 3.5.43 3.5.44 3.5.45 3.5.46 3.5.47 Schedule-controlled generation of reports......................................................... 91 Saving report...................................................................................................... 91 Resetting measurement values.......................................................................... 92 Sorting elements in a user-defined tree................
Applications 1 Applications The visualisation software ecoExplorer go is designed for the management of measurement devices and the measurement values they capture. ecoExplorer go currently supports the following measurement devices made by Weidmüller Interface GmbH & Co.
Supported operating systems 2 Supported operating systems The visualisation software ecoExplorer go can be installed on computers/PCs with a minimum resolution of 1280 x 960 pixels and with the following operating systems: • • • • • 8 Windows XP® (from Service Pack 3) Windows Vista® (from Service Pack 1) Windows 7® (32Bit, 64Bit) Windows 8® (32Bit, 64Bit) Windows Server® (from Version 2003 R1) 2008050000/03/02-2018
Working with ecoExplorer go – First steps with ecoExplorer go 3 Working with ecoExplorer go 3.1 First steps with ecoExplorer go 3.1.1 Welcome window The Welcome window can be opened under the menu item “Window/Welcome” and provides support to initial steps when working with ecoExplorer go. Fig.: Welcome window Creating a project To be able to work with ecoExplorer go, at least one project must be open.
Supported operating systems – First steps with ecoExplorer go 3.1.2 Creating new project • New projects are created under the menu item File/New project or via the “Welcome window”. • Set the selection to “Database project” in the “Projects” pane and confirm the selection with “Next”. Fig.
Supported operating systems – First steps with ecoExplorer go • Give the project a name and identify the location it is to be saved to. The “Browse” button can also be used to find and specify the location the project is to be saved to. • For smaller projects with only a few devices and little data, you can use the File DB database included in the scope of delivery. When using the standard database (File DB), clicking on “Finish” saves the project.
Supported operating systems – First steps with ecoExplorer go 3.1.3 Opening existing project • Use the menu item “File/Open project” to select and open an existing ecoExplorer go project (projects from Version 2.x). • Select the desired project in the selection window and open it by clicking on the “Open project” button.
Supported operating systems – First steps with ecoExplorer go 3.1.4 Creating new device • If a project has been created, a device can be added for example using the menu item “File/New file”. • Select the type of device, listed under the device category, and confirm the selection with “Next”. Fig.: Device selection • Different types of connections will be offered depending on the type of device.
Supported operating systems – First steps with ecoExplorer go • Connection type “No connection” Devices can be installed without a connection type - e.g. for a pre-configuration of the ecoExplorer go software. With this connection type, measurements of voltages, currents etc. are not possible. • Connection type “Modbus RTU” Devices, which should communicate via Modbus, can be activated via this connection. Interface, baud rate and device address must be known.
Supported operating systems – First steps with ecoExplorer go • Connection type “Ethernet TCP/IP” Devices with an Ethernet interface and known Ethernet address can be integrated via the connection type “Ethernet” in ecoExplorer go. The TCP / IP device address must be known for this purpose. • Connection type “Ethernet gateway (e.g. for devices on the RS485)” Devices that are connected via the RS485 as slave to a master device are activated via this connection type.
Supported operating systems – First steps with ecoExplorer go • Connection type “secured TCP/IP” Via a secured connection to the device, the homepage and configuration, for example, can be protected via a password. To this end, the user and password should be entered when encryption is activated. When a connection is successfully established, an additional “Passwords” button appears with which rights can be set.
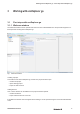
Supported operating systems – First steps with ecoExplorer go 3.1.5 Overview window The overview window provides a clearly organised overview of the most important device actions and information about the devices organised by the types of devices/device groups selected in the project window. • To open the navigation window, select the menu item “Window/Navigation”. • To open the project window, select the menu item “Window/Projects”.
Supported operating systems – First steps with ecoExplorer go Fig.
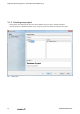
Supported operating systems – First steps with ecoExplorer go 3.1.6 Displaying graphs Selected measurement values can be visualised in a graph window by selecting “Graphs” in the project window. • Measurement values from devices can be displayed directly in a graph. • Measurement values from different devices can be displayed in a single graph. • No more than two different kinds of measured value types (e.g. current and voltage) can be displayed in a single graph.
Supported operating systems – First steps with ecoExplorer go • Using Open groups in the value tree window, select the desired measurement values (holding the key down allows the selection of more than one measurement value). • Using the mouse, drag the selected measurement values into the graph window. • ecoExplorer go imports the measurement values directly from the device and displays these in a graph.
Supported operating systems – First steps with ecoExplorer go 3.1.7 Adding topology A new topology page, used to visualise devices and measurements, can be created by selecting and right clicking on Topology in the Projects window. • Devices, online measurements, links, texts and images can be incorporated in a single topology page. • To open the project window, select the menu item “Window/Projects”. • To open the value tree, select the menu item “Window/Value tree”.
Supported operating systems – First steps with ecoExplorer go Fig.
Supported operating systems – ecoExplorer go menu 3.2 ecoExplorer go menu 3.2.1 File menu 3.2.1.1 New Project • New projects are created under the menu item File/New project or via the “Welcome window”. • Set the selection to “Database project” in the “Projects” pane and confirm the selection with “Next”. Fig.
Supported operating systems – ecoExplorer go menu • Give the project a name and identify the location it is to be saved to. The “Browse” button can also be used to find and specify the location the project is to be saved to. • For smaller projects with only a few devices and little data, you can use the File DB database included in the scope of delivery. When using the standard database (File DB), clicking on “Finish” saves the project.
Supported operating systems – ecoExplorer go menu 3.2.1.2 New File • If a project has been created, a device can be added for example using the menu item “File/New file”. • Select the type of device, listed under the device category, and confirm the selection with “Next”. Fig.: Device selection • Different types of connections will be offered depending on the type of device.
Supported operating systems – ecoExplorer go menu • Connection type “No connection” Devices can be installed without a connection type - e.g. for a pre-configuration of the ecoExplorer go software. With this connection type, measurements of voltages, currents etc. are not possible. • Connection type “Modbus RTU” Devices, which should communicate via Modbus, can be activated via this connection. Interface, baud rate and device address must be known.
Supported operating systems – ecoExplorer go menu • Connection type “Ethernet TCP/IP” Devices with an Ethernet interface and known Ethernet address can be integrated via the connection type “Ethernet” in ecoExplorer go. The TCP / IP device address must be known for this purpose. • Connection type “Ethernet gateway (e.g. for devices on the RS485)” Devices that are connected via the RS485 as slave to a master device are activated via this connection type.
Supported operating systems – ecoExplorer go menu • Connection type “secured TCP/IP” Via a secured connection to the device, the homepage and configuration, for example, can be protected via a password. To this end, the user and password should be entered when encryption is activated. When a connection is successfully established, an additional “Passwords” button appears with which rights can be set.
Supported operating systems – ecoExplorer go menu 3.2.1.4 Recent projects window • The most recently used projects can be directly accessed via this menu item. In the process, the selected project is also listed in the Projects window. 3.2.1.5 Closing project • The project selected in the projects window is closed via this menu selection. If several projects are selected in the projects window, these will all be closed.
Supported operating systems – ecoExplorer go menu 3.2.1.7 Project group • • • • • A project group is a combination of several projects that can be presented together in ecoExplorer go. Project groups can be managed under the menu item “File/Project group”. To create a new group, select “New group...” Give the new project group a name. Select from among the available options with: -- Free Group Includes any project.
Supported operating systems – ecoExplorer go menu 3.2.1.8 Project group properties • Specific project-related properties can be defined via the menu “File/Project Properties”: • Project Description Enables the current project to be individually described. Password Enables assignment of an individual password or activates user management for the current project. -- Under Category, select “Password”.
Supported operating systems – ecoExplorer go menu Watchdog This function enables other JASIC-compatible devices (with a separately installed extension) to monitor ecoExplorer go. A schedule for the watchdog event and the device must be selected in this case. Fig.: Project properties / Description 3.2.1.9 Saving • These functions enable the saving of JASIC files or topology views, for example. • The “Save as” function also enables a file name to be entered (e.g. for JASIC files).
Supported operating systems – ecoExplorer go menu 3.2.1.10 Setting up print page • Enables a printer page to be configured in terms of paper, alignment and borders. More information can be found in your printer’s documents. Fig.: Setting up pages for printer 3.2.1.11 Quitting • ecoExplorer go is closed via this menu item.
Supported operating systems – ecoExplorer go menu 3.2.2 Edit menu 3.2.2.1 Editing • “Undo” menu Last action is reversed. • “Repeat” menu Last action is repeated. • “Cut” menu Move highlighted texts, objects, etc. to the clipboard • “Copy” menu Copy highlighted texts, objects, etc. to the clipboard • “Paste” menu Move highlighted texts, objects, etc. out of the clipboard • “Delete” menu Delete selected texts, objects, etc. 3.2.3 View menu 3.2.3.
Supported operating systems – ecoExplorer go menu 3.2.4 Extras menu 3.2.4.1 Updating devices Project devices can be updated with new firmware by selecting “Update devices” in the “Extras” menu. • A path and filename for the update file can be entered by selecting “...”. • Then select the devices to be updated with firmware and define the update areas. Fig.
Supported operating systems – ecoExplorer go menu 3.2.4.2 Exporting device list Project devices with their addresses etc. can be exported to a text file by selecting “Export device list” in the “Extras” menu. Using Import device list, this device file can be integrated into other projects. It can also be imported into other programs. • To export the device list, select the menu item Extras/Export device list. • Select the source project in the selection field. Fig.
Supported operating systems – ecoExplorer go menu • • • • The path and filename can be entered by selecting “...”. Give the file a unique name and select a file type. Save returns you to the previous window. Finish the action with Finish. Fig.
Supported operating systems – ecoExplorer go menu 3.2.4.3 Importing device list A project device list can be added by selecting “Import device list” und er the “Extras” menu. • To import the device list, select the menu item “Extras/Import device list”. Fig.
Supported operating systems – ecoExplorer go menu • In the selection field, select the project in which the device is to be integrated. • The path and the filename for the device list to be opened can be entered under “...”. • Select an existing device list. Fig.: Selecting device list • Clicking Open returns you to the previous window. • Selecting Finish starts the importing of the device list.
Supported operating systems – ecoExplorer go menu A message window shows how much of the list has been imported and notifies you about possible errors, warnings and information you should be aware of. You can find more information under “Show me”. Fig.: List of import messages 3.2.4.4 Options • General Enables configuration of proxy settings for special internet access.
Supported operating systems – ecoExplorer go menu • Appearance Enables various settings determining the appearance of windows. • Graphs Graph properties settings for memory depth, background and graph colour. -- Background colours for graphs can be selected in the colour palette using the “Change colour” button. -- The colour can be customised by selecting a graph in the node structure and then selecting the corresponding colour field with “Click to change colour” colour panel.
Supported operating systems – ecoExplorer go menu 3.2.5 Window menu 3.2.5.1 Window • “Overview” menu Opens the navigation window and provides specific information relevant to the selected device group or device. Devices can be added, deleted, synchronised, configured and their links tested in the navigation window. • “Value tree window” Opens the value tree window with the value graph options relevant to the respective devices.
Supported operating systems – ecoExplorer go menu • “Float Group” and “Dock Group” The current window group is undocked from ecoExplorer go or redocked (see “Float window” and “Dock window”). Create tabulator for new document group (“New Document Tab Group”) and delete it (“Collapse Document Tab Group”): Creation of document groups (window group), each of which is displayed in a lower level area. If several document windows (e.g.
Supported operating systems – ecoExplorer go menu Fig.
Supported operating systems – ecoExplorer go windows 3.3 ecoExplorer go windows 3.3.1 Window management The current window in the ecoExplorer go user interface can be unpinned using the menu item Window/ Unpin window or by dragging the window to the Windows desktop (unpinning). Unpinned windows can be moved on the Windows desktop as desired. If active, unpinned windows can be reintegrated in the ecoExplorer go user interface using the menu item Window/Pin window. 3.3.
Supported operating systems – ecoExplorer go windows 3.3.3 Projects window Display of the open projects incl. the corresponding tree structure. • Devices List of all devices used in the project. Further devices can be added to the project (Creating new device) via the menu item “File/New file”. Double-clicking on a subnode opens the document navigation window with additional information. • Jasic templates List of all Jasic programs integrated in the project.
Supported operating systems – ecoExplorer go windows Fig.
Supported operating systems – ecoExplorer go windows 3.3.4 Value tree window Display in a tree structure of possible measurement values for the current device. By opening a branch, measurement values can be highlighted using the mouse and dragged, for example, to a graph or topology window for visualisation (Adding graphs, Topology view). • “Online values” Presentation of all current measurement values in a tree structure.
Supported operating systems – ecoExplorer go windows 3.3.5 Navigation window View of the most important device actions/information, depending on the types of devices/device groups selected in the projects window (First steps). • • • • • • • Adding a new device Reading out memory Configuring device Configuring connection Connection test Resetting (resetting device values) Printing report Fig.
Supported operating systems – ecoExplorer go windows Fig.
Supported operating systems – ecoExplorer go windows 3.3.6 Files window The file window shows the project-specific file structure in a tree structure. A file can, for example, be opened, renamed or deleted by right-clicking it. Fig.
Supported operating systems – ecoExplorer go windows 3.3.7 Favourites window Favourites are links to folders, saved graphs and to Jasic and topology pages. Favourites are selected and managed (right click) in the Favourites window (Add to favourites) • Saving file-folder as favourite A file-folder is saved as a favourite by clicking in the favourites window with the right mousekey. A folder is selected via the pop-up menu “Add to favourites”.
Supported operating systems – ecoExplorer go windows 3.3.8 Palettes window Providing for additional functions (e.g. within the graphic view or in the Jasic programming). The palette functions can be used by selecting a function module and then by dragging the icon onto the graphic or Jasic interface. Fig.
Supported operating systems – ecoExplorer go windows Fig.
Supported operating systems – ecoExplorer go windows 3.3.9 Properties window Display of selected object properties (e.g. the device properties) as a function of the selection made in a project window (e.g. of a device). Properties for a device selection with display of: • Device type • Device name • Device description • Instance management • Supported device standards • Device connection Fig.
Supported operating systems – ecoExplorer go windows 3.3.10 Configuration window Device configuration overview, e.g. IP configuration and device name. • Via the pop-up menu -- Select a device in the projects window. -- Right-click the device to open the pop-up menu and select “Configuration”. • Via the navigation window -- Select a device in the projects window. -- Via the menu “Windows/Overview”, open the overview window and then click the “Configuration” button.
Supported operating systems – ecoExplorer go windows Fig.
Supported operating systems – ecoExplorer go windows 3.3.11 Jasic environment window View of the Jasic environment used to program and manage Jasic templates. Jasic is similar to the programming language Basic and is supported by various devices. Programs can be programmed in ecoExplorer go in text mode or graphically. • Graph / Editor view Graphic or editor-based view of the Jasic environment. • Save (in file) Saves the current Jasic template • Transmit to...
Supported operating systems – ecoExplorer go windows Fig.: Jasic environment 3.3.12 Graphs window The graph window Displays measurement values that were retrieved via an online connection or from a database in a graph (Adding graphs). Save graph settings to a file saves the created views and lists them as an additional node under Graphs. • The measurement values can be derived from different devices. • No more than two different kinds of measured value types (e.g.
Supported operating systems – ecoExplorer go windows the graph. This displays the measured amplitude spectrum difference relative to the time difference in the highlighted area. • Center zero Alignment of the amplitude spectrum centre with a centred zero baseline within the graphs. • Reset zoom Resets the zoomed graph display. • Edit bottom axis Sets the visible time interval on the x axis. • Edit left axis Sets the amplitude spectrum display using a minimum and a maximum value.
Supported operating systems – ecoExplorer go windows Fig.
Supported operating systems – ecoExplorer go windows 3.3.13 Report overview window Representation of saved tasks used in the preparation of reports. Reports can be prepared, saved and planned in the project window with the selection of a report group. • Execute report A report preparation assistant starts after a quality control or cost report is selected in the project window using “Execute”. The report is displayed in a preview window.
Supported operating systems – ecoExplorer go windows 3.3.14 Topology window Representation of topology structures. Added (Adding topology) and saved topology views appear as additional nodes below Topology in the project window. Fig.
Supported operating systems – Graphic programming 3.4 Graphic programming 3.4.1 Jasic start Starting JASIC The Jasic environment provides the interface for the programming and administration of Jasic templates. • Jasic is similar to the program language Basic. Jasic code can be processed by various devices made by Weidmüller GmbH & Co. KG. • Jasic templates are programmed either graphically or with text in ecoExplorer go.
Supported operating systems – Graphic programming 3.4.2 Repeater / Single template Repeater The repeater provides the framework for the Jasic program, i.e. once the delay has run its course, the repeater’s program code (combination of function modules) is executed and further processed. Program modules external to the repeater are executed only once. Repeaters cannot be interconnected and may be used a max. of once in the program. Single (Group) The Single forms another frame for the Jasic program.
Supported operating systems – Graphic programming 3.4.4 Group A group identifies a module with which programming can be managed more easily. A group module has only one input and one output. It ensures that all its inner components have been executed before the module that is downstream of it is run. • Repeaters have two group modules which are processed one after the other. • Repeaters have two group modules of which only one is processed, as a function of the status of the digital input 1. 3.4.
Supported operating systems – Graphic programming 3.4.6 Processing time The following processing times (repetitions) can be set by double-clicking on a free area in the repeater module: • No delay (default setting) • Measurement interval (200 ms) • Second • Minute • Hour • Day 3.4.7 Colour definition Colours have the following meanings when used in the graphic programming (e.g.
Supported operating systems – Graphic programming • Transfer the program in the Jasic environment using the “Transmit to....” button. • Select an active device and an available location in the program and end the action with “Finish”. • Open the Overview window and select the device in the Projects window. Selecting the program just transferred, under “Jasic information”, loads the program to ecoExplorer go and displays it in another program window.
Supported operating systems – Graphic programming 3.4.11 Example: Deleting work Deleting the effective and the apparent consumption metersusing the time switch. The “Reset” function provides the following selections, for example for a Energy Analyser D550: • Resetting all effective and apparent consumption meters. • Resetting all reactive consumption meters. • Resetting all minimum and maximum values. • Resetting the measurement period for EMAX. 3.4.
Supported operating systems – Functions 3.5 Functions 3.5.1 Deleting user-defined tree How: • When a user-created tree via the right context menu Brief description: • Deletes the user-created tree with all elements underneath the tree. Steps: • Select a user-created tree in the projects window, right click to open the pop-up menu and select “Delete tree”. • In the following prompt is acknowledged with “Yes”, the tree is deleted. 3.5.
Supported operating systems – Functions 3.5.3 Configuring the database How: • On selection of the element “Database” in the projects window and “Configure database” in the pop-up menu Brief description: • Enables a change to the database configuration by providing database type, address, port, username, password and path to the database or database name. Steps: • Select the entry “Database” in the projects window, right click to open the pop-up menu and select “Configure database”.
Supported operating systems – Functions 3.5.5 Manage data How: • On selection of the element “Database” in the projects window and “Manage data...” in the pop-up menu Brief description: • Deletes certain data (e.g. devices selected for deletion along with their measurement values) permanently from the database and by doing so improves performance by optimising the database. Steps: • Select the entry “Database” in the projects window, right click to open the pop-up menu and select “Manage data...”.
Supported operating systems – Functions 3.5.6 Properties How: • Right-click to select a device in the projects window. • Using the menu item Windows --> Properties (Properties window). Brief description: • Presentation of additional information on the device (device type, name, description, connection ...) Steps: • Select a device in the projects window and right-click to open the pop-up menu. Select the menu time “Properties”.
Supported operating systems – Functions 3.5.7 Deleting device How: • Right-click to select a device in the projects window. • Select a device in the project window and choose the menu item “Edit --> Delete”. Brief description: • If the selected device is under the tree”By device type”, it will be marked in the database as deleted (see “Manage data”). • If the device (link) is below a tree created by the user, then the link to the device is deleted.
Supported operating systems – Functions 3.5.8 Takeover device How: • Right-click to select a device in the projects window. Brief description: • Assignment of responsibility for the selected device from a service running in the background to the local ecoExplorer go application (see “Transfer device”).
Supported operating systems – Functions 3.5.10 Editing graph axes How: • For display of a graph via the corresponding buttons in the toolbar in Graph window. Brief description: • “Edit bottum axis”: Sets the visible time interval on the x axis. • “Edit left axis”: Sets the amplitude spectrum display using a minimum and a maximum value. • “Edit right axis”: Sets the right axis using a minimum and a maximum value (only with two different measurement value types). Steps: • Create a graph (Creating graph).
Supported operating systems – Functions 3.5.11 Exporting graphs as CSV values How: • When displaying a graph via the button “Export CSV” in Grap hs window. Brief description: • Enables export of the measurement values required for the graph display in a CSV file, which is readable by other programs. Steps: • Create a graph (Create graphs). • Use the “Export CSV” and assign a file name to the export file. Confirm the dialogue with “Save” or “OK”.
Supported operating systems – Functions 3.5.12 Changing graph properties How: • By right-clicking on the respective graph legend to show a graph in the graph window. Brief description: • This function changes various graph and diagram properties • Enables the saving of graphed values from the selected graphs to a CSV file. Steps: • Create a graph (Creating graphs). • Select a graph in the legend and right-click to open the pop-up menu. • Select one of the following graph functions.
Supported operating systems – Functions “Graphs” node in the project window (Create graphs, Graphs window). • Also supports graph display based on historical values in the time period previous day, last week, last month Steps: • Create a graph by dragging a value or a value group into the graph window (Create graphs). • Select the “Save graph settings to a file” button from the toolbar, then assign a configuration name.
Supported operating systems – Functions Fig.: Value tree and graph window 3.5.14 Printing and saving graphs How: • When displaying a graph via the “Print” button in the graphs window. Brief description: • Opens the “Print Graph” window with a print preview of the graph. The preview is saved an printed via the corresponding icons above the display. Steps: • Create a graph (Create graphs). • Use the “Print” button and change over to the newly opened “Print Graph” window.
Supported operating systems – Functions 3.5.15 Creating graphs How: • By selecting the Graphs node in the projects window and dragging at least one measurement value from the Value Explorer into the graph window. • Selection of at least one measurement value in the value tree window and selecting the menu item “Show in graph” by right-clicking in the pop-up menu. Brief description: • Displays selected current and historic measurement values in a diagram Displaying graphs, Graph windows).
Supported operating systems – Functions 3.5.17 Zeroing graphs How: • When displaying a graph via the “Center zero” button in the graphs window. Brief description: • Alignment of the amplitude spectrum centre with a centred zero baseline within the graphs. Steps: • Create a graph (Creating graphs). • Select the “Center zero” button to zero graph. 3.5.18 Zooming graphs How: • When displaying a graph via the “Zoom” button in the Graphs window.
Supported operating systems – Functions 3.5.20 Configuration How: • Right-click to select a device in the Projects window. • When a device is selected in the projects window and then the “Configure” button in the overview window. Brief description: • Opens the configuration window for the device. Steps: • Select a suitable device in the project window.
Supported operating systems – Functions 3.5.21 Copying / inserting How: • Right-click to select a device in the Projects window. • Via the menu “Edit --> Copy” or “Edit --> Paste” Brief description: • Copies the device selected in the projects window to the clipboard, for example, or inserts in from the clipboard. Steps: • Example: Copy device to a new node • Select a device in the projects window and right-click to open the pop-up menu. Select the menu time “Copy”.
Supported operating systems – Functions 3.5.23 Adding a new device How: • Menu item “ File / New File”. • Right-click to select a device group in the Projects window. • With the selection of a device group in the project window using the “Add new device” button in the overview window. Brief description: • For adding a new device to the current project. Steps: • Select the type of device, listed under the device category, and confirm the selection with “Next”.
Supported operating systems – Functions 3.5.24 Palette - Browser window How: • By selecting the “Graphs” node in the Projects window and the menu for the Palette window display. Brief description: • Creates an empty browser window in the graphs window which can show events, harmonics or sequences from the value tree window. Steps: • Select the “Graphs” node in the projects window. • Using the menu item “Window --> Palette”, open the palette window.
Supported operating systems – Functions 3.5.26 Palette - ITI statistics (CBEMA) The ITIC or CBEMA curve (Computer Business Equipment Manufacturers Association) describes the maximum voltage deviation in relation to the event duration that an electronic device has to be able to tolerate. The curve defines permitted tolerances for evaluation of events, thus enabling interpretation of any malfunctions and can be used as evaluation benchmark.
Supported operating systems – Functions Fig.: Areas of the ITIC (CBEMA) curve Fig.
Supported operating systems – Functions 3.5.27 Palette - Statistics How: • By selecting the “Graphs” node in the Projects window and the Palette window display. Brief description: • Creates an empty statistics window in the graphs window, which can be populated with historical values. Steps: • Select the “Graphs” node in the projects window. • Using the menu item “Window --> Palette”, open the palette window. • Drag the “Statistics” symbol by pressing the mousekey to the Graphs window.
Supported operating systems – Functions 3.5.29 Generating a report How: • By selecting one of the report nodes under “Reports” in the Projects window by clicking the “Execute” button in the Report overview window. • With a right-click on a selected report node in the projects window. Brief description: • Creates report with contents in accordance with selected report node. Steps: • Select a report class under the “Reports” node in the projects window (e.g. “Report in accordance with DIN 50160”).
Supported operating systems – Functions 3.5.31 Schedule-controlled generation of reports How: • By selecting a saved report configuration (Save report) under report class in the Projects window and clicking the “Schedule” button in the report overview window. • With a right-click on a saved report configuration in the projects window. Brief description: • Via a schedule, enables automatic execution of a saved report configuration in the background and subsequent saving of the result quantity.
Supported operating systems – Functions 3.5.33 Resetting measurement values How: • By selecting a device in the Projects window by right-clicking in the pop-up menu under “Reset values”. • By right-clicking the “Reset values” button in the overview window when selecting a device in the projects window.
Supported operating systems – Functions 3.5.35 Download memory How: • Right-click to select a device in the Projects window. • By selecting a device in the projects window and then clicking the “Download memory” button in the overview window. • By selecting a device group in the project window and selecting at least one device in the Overview window with the “Download memory” button.
Supported operating systems – Functions 3.5.37 Editing topology page How: • By selecting a newly created topology page in the Projects window by double-clicking the “Edit mode” button in the topology window. Brief description: • Enables a topology page to be edited. Steps: • Double-click a previously created and saved topology page in the projects window (see “Topology window”, “Adding topology”). • Click the “Edit mode” button in the topology window.
Supported operating systems – Functions 3.5.39 Deleting topology page How: • By selecting an existing topology page in the projects window and by right-clicking “Delete topology page” in the pop-up menu. Brief description: • Enables a saved topology page to be deleted. Steps: • Right-click a saved topology page and select “Delete topology page” in the pop-up menu that appears. • Confirm the prompt in relation to the desired deletion with “OK”. This deletes the selected topology page from the project. 3.5.
Supported operating systems – Functions 3.5.41 Adding and configuring topology elements How: • Adding elements: By editing (edit mode) an existing topology page via the palette window, for example • Configuring elements: By right-clicking elements on an existing topology page and selecting the appropriate function in the pop-up menu. Brief description: • Enables topology elements to be added and then configured.
Supported operating systems – Functions Configuring “link” topology element • Double-click a previously created and saved topology page in the projects window via the “Topology” node (see “Add topology page”, “Editing topology page”). • If the palette window is not visible, open it via the “Window --> Palette” menu. • Drag the “Link” element from the palette window and drop it in the topology window area. • Open the flyout menu by right clicking desired element and select the menu item “Title”.
Supported operating systems – Functions from the device element A. Copy the list with the menu item “Copy list of displayed values” in the flyout menu. Create a new device element B (see Adding topology) and delete all associated measurement value displays for this element via “Delete all values from display”. Via the menu item “Insert values from the copied list”, insert the measurement values previously copied from device element A in device element B.
Supported operating systems – Functions • • • • • case the Finish button is concealed and only way to quit the configuration window is via the reset button or corrections must be made previously. Add another image via the “Add image” button. The value range of this image is then initialized with minus infinity (-) to plus infinity (+). As the value range of both images overlap, an error message appears and saving is not possible.
Supported operating systems – Functions Opens a dialog for element configuration with settings for frame, title, background and text colour, font, number of decimal places and enables the configuration of a colour change when the set boundary value is exceeded/undershot. -- “Remove value” Deletes the selected element. -- “Activate automatic scaling (all devices)”, “Switch off scaling (all devices)” The measurement devices for all devices are automatically scaled by ecoExplorer go via their units.
Supported operating systems – Functions 3.5.43 Connection test How: • By right-clicking a device in the projects window. • By selecting a device in the project window via the “Connection test” button in the overview window. • By selecting a device group in the projects window and then selecting at least one device in the overview window via the “ • Connection test” button. Brief description: • Attempts to establish a connection with the selected device(s).
Supported operating systems – Functions 3.5.45 Phasor diagram How: • By selecting a device in the projects window and by right-clicking “Show phasor graph” in the pop-up menu. • In the palette window, by selecting the “Graphs” node in the projects window. Brief description: • Shows the phase angle and the rotary field direction of the selected device in a phasor diagram. • The rotary field usually rotates to the “right”.
Supported operating systems – Functions 3.5.47 Configure time synchronisation How: • By selecting a device in the projects window and right-clicking “Configure time synchronisation” in the pop-up menu. • By selecting a device group in the projects window and at least one device in the overview window, and then right-clicking “Configure time synchronisation” in the pop-up menu.
Supported operating systems – Functions 104 2008050000/03/02-2018
Devices – Energy Meter D370 4 Devices 4.1 Energy Meter D370 4.1.1 Connection to computer Example 1: The Energy Meter D370 has an RS485 interface and the PC has an RS232 interface. An interface converter is required. Example 2: The Energy Meter D370 has an RS485 interface and the PC has an Ethernet interface. A gateway is required. The following devices can be used as gateways: Energy Analyser D550, Energy Analyser 550. 4.1.
Devices – Energy Meter D370 Modbus RTU (RS485/RS232) An interface converter is required to be able to connect the Energy Meter D370 to the PCs RS232 interface and to be able to configure it and read it with ecoExplorer go. • The Energy Meter D370 has an RS485 interface. • An interface converter from RS485 (Energy Meter D370) to RS232 (PC) is required. • Adapt the PCs RS232 interface (e.g. COM1) to be used as the interface. • The interface converter is also connected to this interface (e.g. COM1).
Devices – Energy Meter D370 4.1.3.3 Phase mapping The phase wiring and the electricity consumer wiring can be redefined by the phase assignments. 4.1.3.4 Nominal values • The rated frequency applies for all 3 measurement channels. • Select the mains frequency in accordance with the available mains supply. 4.1.3.5 Averaging intervals • The applied exponential messaging method reaches at least 95 % of the measurement value once the reporting time has lapsed.
Devices – Energy Meter D370 4.1.3.7 Serial interface An interface converter is required in order to establish a direct connection between the PC (RS232 interface) and the Energy Meter D370 (RS485 interface). The Energy Meter D370 can only function as a Modbus slave. As more than one Energy Meter D370 can be connected to an interface converter, each Energy Meter D370 must be set with its own device address. Note that the device address 0 is reserved for servicing.
Devices – Energy Meter 610 4.2 Energy Meter 610 4.2.1 Connection to computer Example 1: The Energy Meter 610 and the PC have an RS232 interface. Example 2: The Energy Meter 610 has an RS485 interface and the PC has an Ethernet interface. A gateway is required. The following devices can be used as gateways: Energy Analyser D550, Energy Analyser 550. Example 3: The Energy Meter 610 has an RS485 interface and the PC has an Ethernet interface. A gateway is required.
Devices – Energy Meter 610 the Energy Meter D650 and the PCs RS232 interface (Connection). RS232-RS232 connection • The Energy Meter 610 has an RS232 interface. • Adapt the PCs RS232 interface (e.g. COM1) to be used as the interface. • Baud rate; the baud rate is the speed at which the data is to be transmitted between the PC, the interface converter and the Energy Meter 610. • Device address: set the set Energy Meter 610 device address.
Devices – Energy Meter 610 4.2.3 Configuration 4.2.3.1 Identity • The name is used, among other things, to identify the device in the device list. • Additional information can be saved under Description. 4.2.3.2 Transformers Voltage transformers • The Energy Meter 610 voltage measurement inputs are designed for the measurement of low voltages in which rated voltages (L-N/PE) of up to 300 V against earth can occur. • Voltage transformers are necessary in networks with higher rated voltages.
Devices – Energy Meter 610 • For Energy Analyser D550 and Energy Meter 610 devices with the firmware small Rel. 2.x, the relevant voltage is not adjustable and is always L-N. • In the 3-conductor network (e.g. mean voltage) the relevant voltage relates to a calculated star point. 4.2.3.6 Averaging intervals The applied exponential messaging method reaches at least 95 % of the measurement value once the reporting time has run its course. A reporting time of 10 minutes is set ex works. 4.2.3.
Devices – Energy Meter 610 In contrast to the arithmetical mean, the quadratic mean is of increasing importance when the measurement values vary greatly cyclically. Outliers in the measurement values thus have a greater significance. With a value like voltage, it is a good idea to take this more into account than for a power value. Using the “Delete values” button, selected measurement values can be deleted.
Devices – Energy Meter 610 4.2.3.11 Digital outputs The Energy Meter 610 has two digital outputs. Both of these digital outputs can be programmed as a pulse output (S0 output) or as a comparator group output. Each digital output can be programmed as a NC or NO contact. 4.2.3.12 Comparator • 2 comparator groups, each with 4 comparators (A,B,C,D), are provided for the monitoring of threshold values. • The results of the comparators can be AND or OR linked and the result inverted if desired.
Devices – Energy Meter 610 4.2.3.14 Fieldbus profiles Fieldbus profiles hold a list of values which can be read or written by a PLC over the Profibus. • Using ecoExplorer go, 16 fieldbus profiles can be configured. • The Energy Meter 610 is pre-programmed ex works with 4 fieldbus profiles. • Using the Edit button, the preconfigured fieldbus profiles can be retrospectively changed. • To do so drag the desired measurement value (measurement value group) over the value field.
Devices – Energy Analyser D550 4.3 Energy Analyser D550 4.3.1 Connections to computer Example 1 (RS232-RS485 connection): The PC has an RS232 interface and the Energy Analyser D550 an RS485 interface. An interface converter is required. Example 2 (direct Ethernet connection): The PC and the Energy Analyser D550 have an Ethernet interface. Because there is a direct connection, a “twisted” patch cable must be used.
Devices – Energy Analyser D550 • The address can be input as an address or as a name. • Using Timeout it is possible to limit the time in which to attempt to establish a connection, when no connection exists. • Modbus RTU (RS485/RS232) • An interface converter is required to be able to connect the Energy Analyser D550 to the PCs RS232 interface and to be able to configure it and read it with ecoExplorer go. • An interface converter from RS485 (Energy Analyser D550) to RS232 (PC) is required.
Devices – Energy Analyser D550 4.3.3 Introduction 4.3.3.1 Data memory • The Energy Analyser D550 has a flash memory of 128 MByte. • Of this, approx. 112 MByte are available to the user as data memory. • Homepage add-ons or files loaded to the Energy Analyser D550 via FTP reduce the available data memory.
Devices – Energy Analyser D550 4.3.3.4 Parameter list • The parameter list is a list of addresses for settings that can be directly implemented on Energy Analyser D550. • The parameter list forms part of the installation instructions. If the Energy Analyser D550 is in “Programming mode” you can edit the values in the parameter list with numeric 1 and 2 keys (see Manual). 4.3.3.5 Configuration file init.jas • • • • • init.jas is a text file that is saved in the directory/sys/config/init.
Devices – Energy Analyser D550 -- Current, IL1, IL2, IL3, IL4 -- Effective power, PL1, PL2, PL3, PL4 -- Fundamental-wave reactive power Q0L1, Q0L2, Q0L3, Q0L4 The fundamental wave-reactive power compensation has a measurement error of as much as 0.2 % due to a constant phase shift of 1.5 ° and a ripple of 0.1 %. • Processing time (calculation) -- Typically 5 ms -- Maximum 10 ms Processing time variables: Number and runtime of Jasic programs; homepage accesses.
Devices – Energy Analyser D550 4.3.4.4 Flagging • The identification of unreliable measurement values is called flagging. • During voltage drops or increases or during an interruption, the measuring process can provide unreliable values for other variables (e.g. frequency measurement). It indicates that an extrapolated value can be unreliable. • The Energy Analyser D550 applies the flagging concept in accordance with DIN EN 61000-4-30. 4.3.4.
Devices – Energy Analyser D550 values in the measurement buffer. • Reset Reset deletes the measurement buffer content. • Save Entering save saves the pending measurement values (e.g. burner period) in the corresponding measurement value buffer. • “Value name” At least one value name must be set up (e.g. burner period). NOTE: It is necessary to at least link the save input and a “value input”.
Devices – Energy Analyser D550 4.3.5 Configuration 4.3.5.1 Identity • The name is used, among other things, to identify the device in the device list. • Additional information can be saved under Description. 4.3.5.2 Transformers Voltage transformers • The Energy Analyser D550 voltage measurement inputs are designed for the measurement of low voltages in which rated voltages (L-N/PE) of up to 300 V against earth can occur. • Voltage transformers are necessary in grids with higher rated voltages.
Devices – Energy Analyser D550 • For Energy Analyser D550 and Energy Meter 610 devices with the firmware small Rel. 2.x, the relevant voltage is not adjustable and is always L-N. • In the 3-conductor network (e.g. mean voltage) the relevant voltage relates to a calculated star point. 4.3.5.6 Events • • • • An event occurs if threshold values set for the current and the voltage are violated. An event has a mean value, a minimum or maximum value, a start time and an end time.
Devices – Energy Analyser D550 • • • • -- Manual - the transient monitoring uses the set threshold values. Fast increase: If the difference between two neighbouring sampled points exceeds the set threshold, a transient is recognised. -- Available settings: -- Off - transient monitoring has been switched off. -- Automatic - the threshold value is calculated automatically and comes to 0.2175 times the current 200 ms effective value. -- Manual - the transient monitoring uses the set threshold values.
Devices – Energy Analyser D550 4.3.5.11 Recording configuration Recording configuration • Up to 16 records can be configured when configuring recording. • A record can have a maximum of 1000 values. • A record holds a measurement value or the mean value of the measurement value. • Mean value records can also include the minimum and the maximum values. • Mean values, minimum values and maximum values are derived from the measurement values in the measurement timeframe.
Devices – Energy Analyser D550 Calculation of the required memory capacity With the default programming for recordings a data memory of approx. 11 MByte p.a. will be occupied. Recording 1 • 23 values, 900 seconds • (4+4+4) x 23 + 24 = 300 Bytes per dataset • A dataset is written into the memory every 900 seconds. • This means that the required annual memory capacity is =>96 datasets per day, => 35040 datasets p.a., => 10.512 MByte p.a.
Devices – Energy Analyser D550 Time setting • During configuration, the clock can be aligned to UTC time in the connected PC. 4.3.5.14 Time zone All time information with regard to measurement values, events and transients relate to UTC time (Coordinated Universal Time). ecoExplorer go converts UTC time to Central European Time (CET) when it displays measurement results. Central European Time (CET) is the applicable time zone in central Europe and therefore also in Germany.
Devices – Energy Analyser D550 4.3.5.17 Serial outputs • Device ID The device ID (device address) is required for Modbus communication and for the Profibus. • RS485 Setting the Modbus selection between Modbus master, Modbus slave, transparent gateway and BACnet IP.
Devices – Energy Analyser D550 4.3.5.20 Naming of inputs • Enables naming of inputs and outputs. • The respective inputs/appoints can be assigned names by entering a name in the corresponding box.
Devices – Energy Analyser D550 4.3.6 Serial interfaces 4.3.6.1 Ethernet Ethernet: Introduction To be able to operate the Energy Analyser D550 in the Ethernet, the Energy Analyser D550 requires an Ethernet address. There are three options here: • Fixed IP address In networks without a DHCP server, the network address must be set directly in the Energy Analyser D550. • BootP BootP allows for the fully automatic integration of a Energy Analyser D550 into an existing network.
Devices – Energy Analyser D550 311 = --- xxx --- --- (IP gateway) 312 = --- --- xxx --- (IP gateway) 313 = --- --- --- xxx (IP gateway) Ethernet: Ports Devices equipped with the Ethernet option can use the following ports: • UDP • TFTP 1201 • Modbus/TCP 502 • DHCP 68 • NTP 123 • BaCnet 47808 • Nameservice 1200 • TCP • HTTP 80 (can be edited in the ini.jas) • FTP command port 21, (data port 1024, 1025, 1026, 1027) • Modbus/TCP 502 (4 ports) • Modbus RTU via Ethernet 8000 (1 port) 4.3.6.
Devices – Energy Analyser D550 • • • • • • • plete command was issued, this code indicates that no program function preceded it. 2 (Illegal Data Adress) The data address received in the query is not an allowable address for the slave. 3 (Illegal Data Value) A value contained in the query data field is not an allowable value for the slave. 4 (Slave Device Failure) An unrecoverable error occurred while the slave was attempting to perform the requested action.
Devices – Energy Analyser D550 can write new contents to a group of 4XXXX registers, and then return the contents of another group of 4XXXX registers. Broadcast is not supported. Energy Analyser D550 supports the following Modbus functions as slave: • 03 Read Holding Registers Reads the binary contents of holding registers (4X references) in the slave. • 04 Read Input Registers Reads the binary contents of input registers (3X references) in the slave.
Devices – Energy Analyser D550 4.3.7.3 Encryption Directories created by the system cannot be deleted. • Files between ecoExplorer go and the Energy Analyser D550 can be encrypted for transmission. • Files can be AES encrypted. • AES stands for Advanced Encryption Standard. AES is a symmetrical encryption technology. 4.3.7.4 Authentification procedure • The Energy Analyser D550 can use the CRAM-MD5 authentication procedure when connecting to ecoExplorer go.
Devices – Energy Analyser D550 -- Username: guest -- Password: tbd -- Password forgotten • Homepage password -- The homepage password (Modbus address 502) provides administrator rights for the device homepage. -- The homepage password enables loading and starting Jasic programs on the device homepage. -- Password mode (Modbus address 501). The Energy Analyser D550 uses three different password modes to access the homepage: -- 0 - The homepage password is not requested at all.
Devices – Energy Analyser D550 -- The FTP password is required in order to transfer files between ecoExplorer go and the device via Modbus RTU over Ethernet.
Devices – Energy Analyser 550 4.4 Energy Analyser 550 4.4.1 Connection to computer Example 1 (RS232-RS485 connection): The PC has an RS232 interface and the Energy Analyser 550 an RS485 interface. An interface converter is required. Example 2 (direct Ethernet connection): The PC and the Energy Analyser 550 have an Ethernet interface. Because there is a direct connection, a “twisted” patch cable must be used. Example 3 (Ethernet connection): The PC and the Energy Analyser 550 have an Ethernet interface.
Devices – Energy Analyser 550 • The address can be input as an address or as a name. • Using Timeout it is possible to limit the time in which to attempt to establish a connection, when no connection exists. • Modbus RTU (RS485/RS232) • An interface converter is required to be able to connect the Energy Analyser 550 to the PCs RS232 interface and to be able to configure it and read it with ecoExplorer go. • An interface converter from RS485 (Energy Analyser 550) to RS232 (PC) is required.
Devices – Energy Analyser 550 4.4.3 Measurement The Energy Analyser 550 has 4 measurement channels used to measure the current (I1..I4) and 4 measurement channels used to measure the voltage (V1..V4 against Vref). Measured voltage and measured current for the measurement channels 1-4 must derive from the same network. • Baseline measurement • The baseline measurement uses the measurement channels 1-3. • Use the measurement channels 1-3 in three-phase systems.
Devices – Energy Analyser 550 4.4.3.3 Jasic • 7 Jasic programs can be executed simultaneously in the Energy Analyser 550. • 128 kByte of memory is available for each program. • Jasic programs are easily created with the graphic programming integrated into ecoExplorer go. 4.4.3.4 Relevant voltage In three-phase systems, measurements can be carried out between the outer conductors and between the outer conductors and the star point.
Devices – Energy Analyser 550 Current transformers • The converter requirements for the main measurement and secondary measurement must be determined separately. • Select the 5/5 A setting when measuring currents directly. 4.4.3.7 Phase mapping The phase wiring and the electricity consumer wiring can be redefined by the phase assignments. 4.4.3.8 Connection variants Set the device’s connection variant for the voltage and current measurements (operating manual). 4.4.3.
Devices – Energy Analyser 550 • The threshold values are set for excess voltage, undervoltage, voltage interruption and overcurrent as a percentage of the nominal values. • Threshold values can be switched off by switching the Manual/Off button to Off. 4.4.3.11 Event recording • Effective values recorded in the Energy Analyser 550 describe the change in half wave effective values. • Effective value recording can be started by an event.
Devices – Energy Analyser 550 This automatic increase of the threshold value switches off within 10 minutes. • If a transient has been recognised, the wave form will be saved to a transient record. • If a further transient is recognised within the next 60 seconds, it will be recorded with 512 points. 4.4.3.13 Transients recording • If a transient has occurred, the wave shape can be saved in a transient record with an adjustable number of sampled points before and after the transient.
Devices – Energy Analyser 550 • The mean value measurement timeframe is established by the time set under “Time basis”. • Measurement values are saved once the time set under “Time basis” has run its course (Data memory capacity calculation using Energy Analyser D550 as example). Setting up / editing a recording configuration • An individual recording instance can be set up using the New or Edit buttons. • Measurement values are selected in the recording window using the Add values button.
Devices – Energy Analyser 550 -- 10 % for the recording of events. -- 5 % for the recording of flags (flagging). 4.4.3.17 Time The Energy Analyser 550 has a clock with a battery backup. The fault in the clock’s quartz is aligned with room temperature during production so that the clock only deviates by +-1 minute/month.
Devices – Energy Analyser 550 4.4.3.20 Digital outputs The Energy Analyser 550 has five digital outputs. Both of these digital outputs can be programmed for event messages or as a pulse output (S0 output). • Each digital output can be programmed as a NC or NO contact. • One or more events can be allocated to an output if it is programmed for event updates. • The event output activates if a selected event occurs. 4.4.3.
Devices – Energy Analyser 550 • DHCP mode When started, the Energy Analyser 550 obtains all its settings from the DHCP server. IMPORTANT: Setting should only be undertaken after these have been discussed with the administrator. 4.4.3.24 Naming of inputs • Enables naming of inputs and outputs. • The respective inputs/outputs can be assigned names by entering a name in the corresponding box. 4.4.4 Interfaces 4.4.4.
Devices – Energy Analyser 550 2. Set the desired IP address, IP screen and IP gateway. Put the Energy Analyser 550 into parameterisation mode as explained in the operating manual and set the Ethernet address under Communication. Ethernet: Ports Devices equipped with the Ethernet option can use the following ports: • UDP • TFTP 1201 • Modbus/TCP 502 • DHCP 68 • NTP 123 • BaCnet 47808 • Nameservice 1200 • TCP • HTTP 80 (can be edited in the ini.
Devices – Energy Analyser 550 150 2008050000/03/02-2018
www.weidmueller.com Weidmüller Interface GmbH & Co. KG Klingenbergstraße 16 32758 Detmold Germany Phone +49 (0) 5231 14-0 Fax +49 (0) 5231 14-292083 info@weidmueller.com www.weidmueller.