
Product Manual
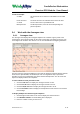
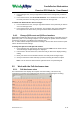
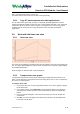

Table Of Contents
- 1. Getting started
- 2. Recording an exercise ECG
- 2.1 The Real-time monitor
- 2.2 Record an exercise ECG
- 2.3 Real-time monitor
- 2.3.1. Select how you want to view leads
- 2.3.2. Measure blood pressure
- 2.3.3. Capture an event
- 2.3.4. Patient Perception Parameters
- 2.3.5. Duke Treadmill Score
- 2.3.6. Add a comment
- 2.3.7. Apply filters
- 2.3.8. Manual load change
- 2.3.9. Pacemaker pulse detection
- 2.3.10. Signal quality indication
- 2.3.11. Printing during recording
- 2.3.12. Target heart rate
- 2.3.13. Target Workload
- 3. Viewing an exercise ECG
- 3.1 About viewing exercise ECGs
- 3.2 View an exercise ECG
- 3.3 Work with the Summary view
- 3.4 Work with the Averages view
- 3.5 Work with the Full disclosure view
- 3.6 Work with the 2x6 and 4x3 view
- 3.7 Work with the Trends view
- 3.8 Work with the ST table view
- 3.9 Work with the Heart rate view
- 3.10 Work with the ST/HR view
- 4. Interpreting an exercise ECG
- 5. Printing an exercise ECG
- 6. Maintaining the recorder
- 7. Customizing the Exercise ECG module
- 8. Customize exercise protocols
- 9. Troubleshooting
- 10. Before installing the Exercise ECG software
- 11. Installing the Exercise ECG Module
- 12. Safety and precautions
- 13. Guidance and Manufacturer’s Declarations
- 14. Function keys
- 15. Additional information

CardioPerfect Workstation
Exercise ECG Module - User Manual
If accurate ST segment contours are required for ECGs, do not use the 0.5 Hz baseline
wander filter. This filter suppresses baseline wander to the extent that it may alter the ST
segment. Instead, configure your cardiograph to operate without the baseline wander filter.
Regardless of the filter used, the rhythm characteristics of the ECG are accurately recorded
and do not affect the interpretation algorithm.
3.7 Work with the Trends view
Trends view
The trends view displays various trend graphs:
For each of the twelve leads, the Trends view displays the ST trends
as measured from the ST reference point, together with the ST
slopes. You can change the ST reference point.
ST trends
The Workload graph shows the workload against time. The workload
is expressed in Watts for an ergometer test, and in METS for
treadmill tests.
Workload graph
The Heart rate graph shows the patient's heart rate against time.
From the shortcut menu you can also select to display the VES trend
in the Heart rate graph.
Heart rate graph
The blood pressure graph shows the patient's blood pressure
against time. From the shortcut menu you can also select to display
the RPP in the Blood pressure graph.
Blood pressure
graph
3.7.1. Set a different ST reference point
You can change the reference point for the ST calculation both during recording and viewing.
The values for the ST reference point can be:
J+0
J+20
J+40
J+60
J+80
J+Dynamic (J+1/16*(R-R))
To set a different ST reference point:
In the View menu, point to ST Reference Point and select a value.
DIR 80012335 Ver. D 36 / 83