
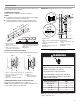
Unit installation


9
4. Compare stabilized pressures with those provided in the
Normal Operating Pressures chart.
NOTES:
■ Minor variations in these pressures may be expected due
to differences in installations.
■ Significant differences could mean that the system is not
properly charged or that a problem exists with some
component in the system.
■ Pressures higher than those listed indicate that the
system is overcharged.
■ Pressures lower than those listed indicate that the system
is undercharged.
■ Verify adjusted charge using the approach method.
5. Use the same digital thermometer to check liquid line
temperature.
6. Subtract the outdoor ambient temperature from the liquid line
temperature to determine the approach temperature.
_____ ° (Liquid Line Temperature °F) - _____ ° (Outdoor
Ambient Temperature °F) = _____ ° (Approach
Temperature °F)
7. Compare the approach value with those shown in the
Approach Values for Thermal Expansion Valve Systems
charts.
■ If the approach values are too high, add refrigerant to
lower the approach temperature
■ If the approach values are too low, recover refrigerant
from the system to increase the approach temperature.
■ Approach value is the liquid line temperature minus the
outdoor ambient temperature (∆°F).
NOTE: For best results, use the same digital thermometer to
check both outdoor ambient and liquid temperatures.
Check Charge Using Normal Operating Pressures
Use the Normal Operating Pressures chart to perform
maintenance checks.
NOTES:
■ This chart is not a procedure for charging the system.
■ Minor variations in these pressures may be due to differences
in installations.
■ Significant deviations could mean that the system is not
properly charged or that a problem exists with some
component in the system.
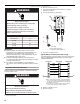
Approach Values for Thermal Expansion Valve Systems
Model W4GC624A W4GC636A
Temperature ºF 8 10
Model W4GC648A W4GC660A
Temperature ºF 8 4
Normal Operating Pressures
W4GC624A W4GC636A W4GC648A W4GC660A
Temperature of the Air
Entering the Outdoor Coil Liquid Suction Liquid Suction Liquid Suction Liquid Suction
1st Stage (Low Capacity)
65 (18) 244 136 238 133 247 130 250 125
75 (23.9) 283 138 278 135 281 134 291 127
85 (29.4) 326 141 324 137 325 137 334 130
95 (35) 376 142 374 139 336 139 383 133
105 (40.6) 428 144 429 142 428 141 434 136
115 (46.1) 486 146 500 144 485 144 489 139
2nd Stage (High Capacity)
65 (18) 249 126 251 129 249 123 243 117
75 (23.9) 288 133 291 135 286 129 285 123
85 (29.4) 331 138 334 139 328 133 329 129
95 (35) 379 143 383 143 372 137 376 134
105 (40.6) 325 147 435 147 419 141 427 137
115 (46.1) 481 150 490 150 475 145 485 141
NOTE: Values provided are typical pressures. Indoor unit match-up, indoor air quality and indoor load will cause pressures to vary.