
Datasheet


Deleting a Chart
To delete an embedded chart, press Ctrl and click the chart (this selects the chart as an
object). Then press Delete. When the Shift key is pressed, you can select multiple charts
and then delete them all with a single press of the Delete key.
To delete a chart sheet, right-click its sheet tab and choose Delete from the shortcut
menu. To delete multiple chart sheets, select them by pressing Ctrl while you click the
sheet tabs.
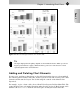
Adding Chart Elements
To add new elements to a chart (such as a title, legend, data labels, or gridlines), use
the controls in the Chart Tools➪Layout group. These controls are arranged into logical
groups, and they all display a drop-down list of options.
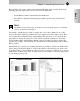
Moving and Deleting Chart Elements
Some of the elements within a chart can be moved. The movable chart elements include
the plot area, titles, the legend, and data labels. To move a chart element, simply click it
to select it. Then drag its border. The easiest way to delete a chart element is to select it
and then press Delete. You can also use the controls in the Chart Tools➪Layout group
to turn off the display of a particular chart element. For example, to delete data labels,
choose Chart Tools➪Layout➪Labels➪Data Labels➪None.
Note that deleting a chart element by using the controls in the Chart Tools➪Layout group
deletes the element (it doesn’t just hide it). For example, assume that you add a chart title
and apply formatting to it. Then you use the Chart Tools➪Layout➪Labels➪Chart Title➪
None command to hide the title. If you later decide that you want the title, the previously
formatted title is gone and you need to re-apply the formatting.
A few chart elements consist of multiple objects. For example, the data labels element con-
sists of one label for each data point. To move or delete one data label, click once to select
the entire element and then click a second time to select the specific data label. You can
then move or delete the single data label.
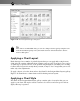
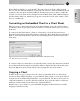
Formatting Chart Elements
Many users are content to stick with the predefined chart layouts and chart styles. For
more precise customizations, Excel allows you to work with individual chart elements
and apply additional formatting. You can use the Ribbon commands for some modifications,
but the easiest way to format chart elements is to right-click the element and choose
Format from the shortcut menu. The exact command depends on the element you select.
For example, if you right-click the chart’s title, the shortcut menu command is Format
Chart Title. Alternatively, you can press Ctrl+1 to display the Format dialog box for the
selected element.
Part I: Chart Basics
28
05_044001 ch01.qxp 8/24/07 8:48 PM Page 28