
User's Manual
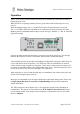
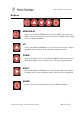
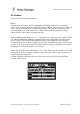
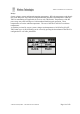

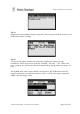

Table Of Contents
- Introduction
- Safety Information
- Operation
- Buttons
- Main Screens
- Site Configuration Tools
- Two-Way Paging
- Configuration Methods
- MENU Configuration
- Serial Command Configuration
- Protocols
- SCADA Support
- IO Mirror Operation
- Input Handling
- Output Handling
- WTE Output Control Protocol
- WTE Ack and Confirm Protocol
- Store Forward Operation
- Installation
- Input Output Hardware Connection
- Serial Connections
- RF Connections
- Power Connections
- Ethernet Interface
- TReX Firmware Upgrade
- Physical Dimensions
- Mounting Hardware
- Omni or Directional Antenna
- Antenna Elevation
- Disclaimer
- Manufacturing marking and labels
- Maintenance
- Product End Of Life
- Product Warranty
- Abbreviations and Glossary
- Specifications

TReX User Manual v2.14 Firmware
IO Screens
Screens that relate to inputs and outputs.
IO (1):
All input and output states. Each IO highlighted state changes if the IO level is HIGH or
LOW. There is a small line above each input or output if HIGH, and a line below if LOW. All
ADCs (analog inputs) and DACs (analog outputs) show a bar graph as a proportion of full
scale and display a raw count from 0-1023. When scaling has been applied to an analog
output, the DAC value shown is the unscaled value.
In the middle, shown in larger text is “01”. The number“01” in this case is the telemetry UNIT
ID. When TELEMETRY->MODE is configured to SCADA_MASTER a small down arrow
may be visible if the TELEMETRY->REMOTES have been configured to be more than 0.
Pressing the down arrow (when configured as a SCADA_MASTER) allows the UNIT ID to be
cycled to view the IO of each remote slave in the system – allowing a possible system of up to
88 digital IO, 22 ADCs and 22 DACs to be viewed.
Next to the UNIT ID is the smaller number “123”. Each TReX resets this number to the LINK
FAIL TIME each time a message is decoded. This “link count” reduces, and if reaches 0, the
link fail output can be operated.
SCADA_MASTER TReX units allow the “link count” to be viewed for all remote TReX
SCADA_SLAVE units.
© WTE Limited, 2018 – Christchurch New Zealand Page 15 of 158