16
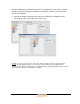
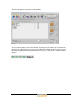
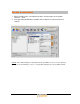
9. Click on „Formula → Spectra“ in the toolbar. In the window that appears there are
drafts and formulas compared in different displays.
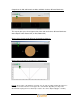
Comparison of the remission curve:
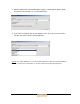
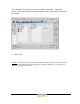
CIELab color circle:
The red cross in the centre shows the draft, the blue cross shows the formula.